FAQ
FAQ検索結果
検索キーワード:
QCom(RS-232Cシリアル)ポートチェック(Com Port Check)
COM PORT CHECK
HYPACKのI/O Test、またはSurvey Programでデバイスが正しく動いていないと思われる時、新しいデバイスでそのフォーマットが分からないときがあるかもしれません。その場合は以下の手順を踏んでください。
始めに行って欲しい事は、Device/hardwareのTestと、PCのコムポートテストです。
そうすれば、デバイスがどのようなメッセージを出力しているか確認できるはずです。
もし、何もメッセージが画面上に表示されなければ、それはHYPACKの問題ではなくて、デバイスの故障、デバイスの設定、ソフトウエアの設定(デバイスは9600 Baudで送っているのに4800 Baudで受信している)等の問題があります。
以下テストの手順です。
Windows 3X
アクセサリーディレクトリをクリック
TERMINALをクリック
メニューバーからSETTINGをクリック
SETTINGメニューからCOMMUNICATIONSをクリック
使用しているデバイスの出力とこの設定を同じにする
OKボタンをクリック
TERMINALはデバイスが送るデータを表示します
Windows95
STARTをクリック
PROGRAMSをクリック
ACCESSORIESをクリック
HYPERTERMINALをクリックHYPERTERMINAL.EXEをクリック
NAMEフィールドに適当な名前を入力
OKボタンをクリック
CONNECT USINGフィールドを使用するポートを指定する
OKボタンをクリック
使用しているデバイスの出力とこの設定を同じにする
OKボタンをクリック
HYPERTERMINALはデバイスが送るデータを表示します
注意:この手法ではCOM1~4までしか使用できません。
Qオートマチック喫水補正用ドライバ(Automatic Draft Device Driver)
通常、船はその船速によりドラフト(喫水線)量が異なります。正確な測量を行うには、測量中のドラフト量の記録を行う必要があります。つい最近ま で、船速をモニターし、そして、ドラフトが変化した時期を決定することが測量士にとって必要であった。そして、測量士は、測量プログラムの中でドラフト量 をマニュアルで変える必要がありました。
HYPACK MAXではこのドラフト量を自動的に更新することができます。
ただし、このデバイスドライバを使用する場合、あなたは、ドラフトテーブルドライバを選択する必要があります。
このデバイスドライバのコンフィギュレーションを行うためには、Draftがチェックをチェックします。このデバイスドライバはシリアルポートの設定の必要性はありません。ただし、それ以外の設定は必要になります。
このデバイスドライバを使用するには表中の船速と対応するドラフト量を入力してください。
以上ですべての設定は終了です。
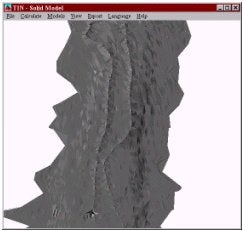
Q自動追尾トータルステーションの利用(Geodimeter ATS 600)
設定
メニューよりHardware-HypackHardwareを選択し、Hardwareプログラムを起動します。Device-AddDeviceを選 択しトリンブル社製自動追尾トータルステーションの場合は"GEODMET2.dll"を選択します。ライカ社製自動追尾トータルステーションの場合 は"Leica.dll"を選択します。トータルステーションではXYZデータを出力するように設定します。
Surveyプログラムでは緯度、経度の欄にXYの値が表示されますが、問題ありません。ただしトータルステーションの機械点座標は適切に設定してください。I
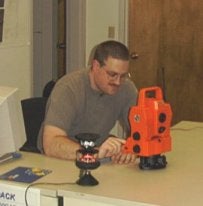
Craig Berry testing the Geodimeter ATS 600 Driver
QGPSの精度比較(GPS Error Specifications--A Comparison of Terms)
GPSの精度の表現方法がいくつか存在します。3mCEPと表記されている場合、データの50%が3m以内に含まれるということになります。
GPSエラープロバビリティは標準偏差のk倍によって与えられる以下の式によってえられます。
以下の表はエラーの相対関係を示します。
| Name | Probability | k | 1 | 2 | 3 | 4 | 5 | 6 | 7 | |
|---|---|---|---|---|---|---|---|---|---|---|
| 1 | 1-sigma (standard ellipse) | 39.35% | 1.000 | 1.00 | 1.18 | 1.41 | 2.00 | 2.45 | 2.83 | 3.00 |
| 2 | Circular Error Probable (CEP) | 50.00% | 1.177 | 0.85 | 1.00 | 1.20 | 1.70 | 2.08 | 2.40 | 2.55 |
| 3 | Distance RMS (DRMS) | 63.21% | 1.414 | 0.71 | 0.83 | 1.00 | 1.41 | 1.73 | 2.00 | 2.12 |
| 4 | 2-sigma ellipse | 86.47% | 2.000 | 0.50 | 0.59 | 0.71 | 1.00 | 1.22 | 1.41 | 1.50 |
| 5 | 95% confidence level | 95.00% | 2.448 | 0.41 | 0.48 | 0.58 | 0.82 | 1.00 | 1.16 | 1.23 |
| 6 | 2 DRMS | 98.17% | 2.828 | 0.35 | 0.42 | 0.50 | 0.71 | 0.87 | 1.00 | 1.06 |
| 7 | 3-sigma ellipse | 98.89% | 3.000 | 0.33 | 0.39 | 0.47 | 0.67 | 0.82 | 0.94 | 1.00 |
Q方位検出のための2つのGPSの使用(Using a Second GPS for Heading)[英語]
The otfgyro.dll is a custom device driver that first appeared in Hypack 8.9. The otfgyro.dll, when used in conjunction with the nmea.dll, will calculate heading when using two GPS receivers that have their antennas mounted fore and aft of the vessel. This method is often preferred on dredges and barges.
The nmea.dll is used with one GPS to calculate position, and should be designated the vessel origin. This is very important when creating the boat shape. Add the NMEA-0183 device (nmea.dll) in the Hardware program and be sure that Position is the only box checked (Figure 1). Do not check the heading box. This will be calculated by the otfgyro.dll. Under the setup dialog box, check only the position information coming from the GPS. This is usually a GGA or GLL message. Do not check the VTG, as this is heading information that will be calculated by the otfgyro.dll.
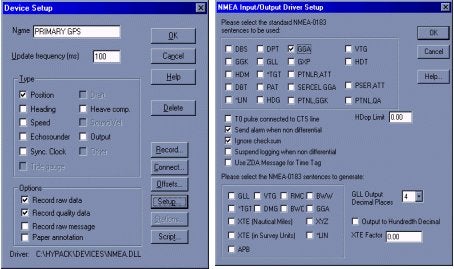
Figure 1: NMEA Device driver setup in Hardware
Now you can load the otfgyro.dll (listed as Coastal Oceanographics OTF-Gyro/Comparison) into the Hardware program. Choose otfgyro.dll from the device list. Hardware will only allow you to check the Heading box. Under the Setup button, be sure to check the message(s) coming in from the GPS (Figure 2). You can also set a distance alarm, which will notify you if the calculated distance between the two GPS antennas exceeds the theoretical distance as defined by the offsets entered in the Hardware program. You MUST enter your offsets in this driver. You should be as accurate as you can with these offsets, as this will be key in determining the correct heading.
Your otfgyro setup is complete once you've connected the receivers to your com ports. Survey will now calculate heading based on position of two GPS antennas. Users can also view the OTF window in Survey (see Figure 3), which gives a visual heading representation, and also displays the distance between the two antennas. The Data Display will display heading, and also give you a distance error between the two antennas.
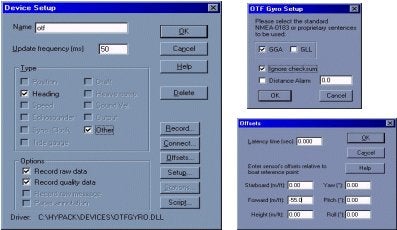
Figure 2: otfgyro Setup in Hardware
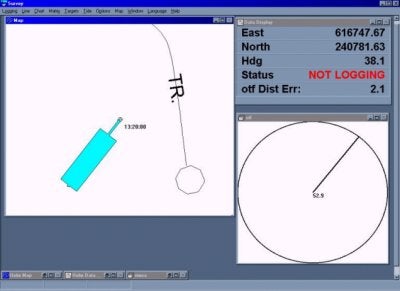
Figure 3: Survey Program
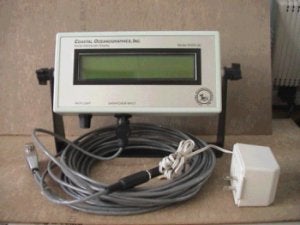
QSHD4-40操舵用ディスプレイ(SHD4-40 Helmsman Display)
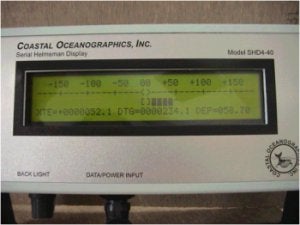
SHD4-40シリアル操舵手用ディスプレイは、操船や測線上を測量する時に操舵手へ必要な情報を供給する為に作られました。これは安価で小型、軽量、丈夫に作られているので小型船での測量にぴったりです。SHD4-40は、HYPACK® survey ソフトウェアと併せて使えるよう組み合せられています。電源とデータは1つのケーブル(4本の線を使用)で供給されるので、簡単かつ迅速に設置出来ます。情報は、工夫された4行×40文字のLEDバックライト付き液晶ディスプレイに表示されます。
操作は最小限に抑えられており、唯一の外部調整は、バックライト強度です。可動式のスタンドにより机上、壁、デッキヘッドへの設置を可能にし、たいていの現場 において艤装できます。値の文字表示に加えて、アナログ自動レンジ調整棒グラフ形式の左右操船指示機能も含まれております。完全防水では有りませんが、 雨、飛沫等のたいていの測量現場において経験する状況に対応できます。
仕様:
|
寸法: |
21cm x 13cm x 4.5cm |
|---|---|
|
ケース: |
Hammond ABS Flame Retardant |
|
電力: |
8VDC~15VDC @ 300mA (最大) |
|
データ入力: |
9600 / 19200 baud 8N1 |
|
電源/I/O ケーブル: |
標準0.5m(必要に応じて延長可) |
|
電源/データコネクタ: |
Switchcraft EN3 Weathertight |
|
ディスプレイモジュール: |
LEDバックライト付Seiko STN Yellow/Green |
|
ディスプレイ寸法: |
147 x 29.5 mm |
|
文字サイズ: |
2.78 x 4.27 mm |
|
ドットサイズ: |
0.55 x 0.55 mm |
|
フォーマット: |
40文字4 行 |
|
可動式のスタンド: |
360°回転可能 |
SHD4-40シリアル操舵手用ディスプレイに関する更なる情報は東陽テクニカ営業第3部までお問い合わせください。
Q千本電気社、カイジョー社製測深機の使用
- 下表を参考にして適切なデバイスドライバ(xxx.DLL)をHYPACKハードウェア設定より選択します。
(注:下表に無いモデルはデータの取り込みが出来ませんので、東陽テクニカにご相談ください。) - 下表のフォーマットに合うように測深機の出力するデータフォーマットを測深機側にて調整します。
|
測深機 |
ドライバ |
データフォーマット(入力データ) |
読み込み水深値 |
|---|---|---|---|
|
PDR103 (千本電機) |
PDR130.DLL |
:HHMMSSYEDDDDD<CR><LF> (DDDDDの位置が水深データ) |
DDD.DD(例:DDDDDが01234の場合12.34) |
|
PDR601 (千本電機) |
PDR6011.DLL |
:YEHHMMSSLLLPPPDDDDD<CR><LF> (DDDDDの位置が水深データ) |
DDD.DD(例:DDDDDが01234の場合12.34) |
|
PDR601 (千本電機) |
PDR6014 .DLL |
:YEHHMMSSLLLPPPDDDDDFFFFFGGGGGJJJJJ<CR><LF> (DDDDDの位置が水深データF,G,Jも同様) |
4 個の水深値 ch1:DDD.DD(例:DDD.DDが01234の場合12.34) ch2:FFF.FF(例:FFF.FFが01234の場合12.34) ch3:GGG.GG(例:GGG.GGが01234の場合12.34) ch4:JJJ.JJ(例:JJJ.JJが01234の場合12.34) (4個の水深値を処理する為には、マルチビーム測深機対応のドングルが必要になります。) |
|
PS20R (カイジョー) |
PS20R.DLL |
データフォーマットの10番目から15番目に水深値が来るように設定してください。 |
123.45(水深値が12345で入力された場合) |
|
PS30R (カイジョー) |
PS30R.DLL |
????????DDDDD??SSTTTT |
DDD.DD(例:DDDDDが01234の場合12.34) |
QNMEA.DLLを使用してGPSから出力されるNMEA0183のメッセージ(GGA, PTNL_GGK等)をHypack Surveyプログラムで集録する
QHypackから測深機のマーク信号をコントロール
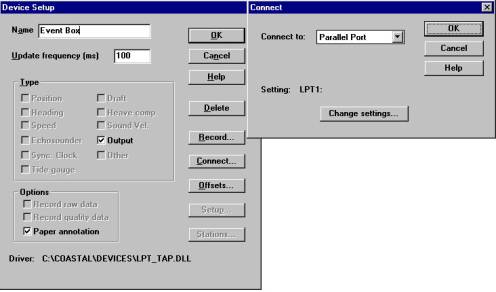
- HYPACK用パソコンのHYPACKドングルにパラレル イベント ボックスのD-sub 25ピンオス型コネクタを接続します。 USBドングルを使用している場合はパソコンのパラレルポートにD-sub25ピンオス型コネクタを直接、接続します。なお、パラレルイベントボックスのD-sub 25ピンメス型コネクタは、プリンター等を接続する場合に使用します。
- このボックスには、9VDC角型電池(数週間の寿命)を使用しています。
ボックスを使用する時には、ボックスのスイッチを“ON”にして下さい。 - ボックスのBNCコネクタ(メス)と測深器のマーク信号入力コネクタ(千本電機社製 PDR1300測深機の場合、No,2”コネクタ(七星:NCS-163R))をケーブルで接続して下さい。
- HYPACK “Hardware”プログラムの“Devices”メニューの“Add Device…”で“Costal Oceanographics Event Mark Generator(LPT_TAP.DLL)”を選択し、以下の画面通りに設定を行なって下さい。
- 以上の設定を行ったら、SURVEYプログラム起動中にCtrl-Nキーを押下するか、LOGGINGメニューのMark eventをクリックすることで測深器にマーク信号を送信することができます。
QHypackで使用するGPSについて(Why should I use a fast update rate for a GPS that only updates 1Hz?)
GPSデバイスのセットアップの際に"sync clock"オプションを設定すると、SurveyプログラムではGPSから送られてくるGGAメッセージのタイムタグを使用します。 しかしながら、他のNMEAメッセージにはタイムタグは含まれていません。 もし、非常に遅いアップデートレートを設定している場合、次のメッセージが流れてくるまでメッセージはコンピュータのバッファにとどまります。
以下の2つのグラフはアップデートタイムの異なる2つのGPSのポジションレコード(GGA)の時刻とヘディングレコード(VTG)の時刻の関係を示します。
VTGレコードにタイムタグは含まれていないためHypackではVTGレコードの解析にはコンピュータの時刻を使用するため以下のようなグラフとなります。
Qフィラデルフィア法体積計算(Philadelphia Volume Tests)[英語]
Tests were conducted on 1-2 March 2000 to determine the accuracy of the different volume techniques in HYPACK® Version 7.1, HYPACK® MAX (Cross Sections & Volumes) and HYPACK® MAX (TIN MODEL). Tests were run with multibeam data collected on a recent USACE Philadelphia project and with a test data set that allowed evaluation of all four box cut methods (Contour vs. Non-Contour; All vs. Shoals-Only).
A sample channel with survey data was created and is shown below.
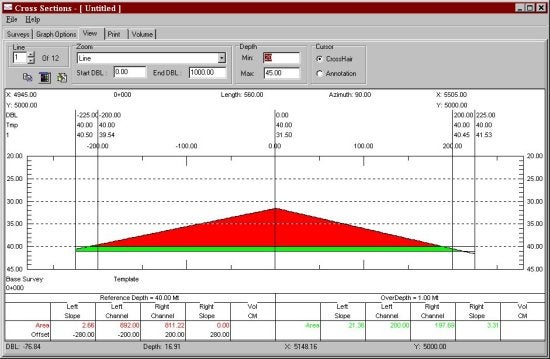
At the left toe-line the depth was above the project design depth. This meant the overdredge material on this side should be included in the Shoals-Only method. At the right toe-line, the depth was below the project depth. This meant that the overdredge material in this area would not be included in the Shoals-Only method.
On the left side, the depth passed through the design depth in the left box area. This means the contour dredge quantity for the left box area should be less than the non-contour dredge quantity. On the right side, the depth passes through the design depth in the "right of center" area. This means the contour dredge quantity for the right of center area should be less than the non-contour dredge quantity.
The points were first loaded into the HYPACK® MAX TIN MODEL program, along with the planned line file. The planned line file contained 11 lines at 100' spacing. Volume numbers presented below are in cubic feet.
TIN MODEL Tests
(Calculated quantities in black; Mathematical prediction in red.)
| Method | Dredge Left Box | Dredge Left Channel | Dredge Right Channel | Dredge Right Box | Overdredge Left Box | Overdredge Left Channel | Overdredge Right Channel | Overdredge Right Box |
|---|---|---|---|---|---|---|---|---|
| Non-Contour All |
3,125 |
900,000 (100%) 900,000 |
802,736 (99.99%) 802,736 |
0.0 (100%) 0.0 |
21,875 (100%) 21,875 |
200,000 (100%) 200,000 |
197,224 (100%) 197,222 |
2,776 (88.78%) 2,750 |
| Contour All | 3,125 (100%) 3,125 |
900,000 (100%) 900,000 |
802,736 (100%) 802,736 |
0.0 (100%) 0.0 |
12,500 (100%) 12,500 |
200,000 (100%) 200,000 |
188,800 (99.95%) 188,888 |
0.0 (100%) 0.0 |
| Contour Shoal-Only | 3,125 (100%) 3,125 |
900,000 (100%) 900,000 |
802,736 (100%) 802,736 |
0.0 (100%) 0.0 |
12,500 (100%) 12,500 |
200,000 (100%) 200,000 |
188,800 (99.95%) 188,888 |
0.0 (100%) 0.0 |
| Non-Contour Shoal-Only | 3,125 (100%) 3,125 |
900,000 (100%) 900,000 |
802,736 (100%) 802,736 |
0.0 (100%) 0.0 |
25,000 (100%) 21,875 |
1,100,000 (100%) 200,000 |
999,960 (529%) 197,222 |
0.0 (100%) 0.0 |
1. All of the Dredge quantities are mathematically correct.
2. The Contour vs. Non-Contour and All vs. Shoals-Only only effect the Overdredge Quantities
3. All of the Overdredge methods appear to be correct, with the exception of the Non-Contour - Shoals Only method. This method is reporting erroneous quantities and needs to be fixed.
HYPACK® 7.1 Tests
(Calculated quantities in black; Mathematical prediction in red.)
| Method | Dredge Left Box | Dredge Left Channel | Dredge Right Channel | Dredge Right Box | Overdredge Left Box | Overdredge Left Channel | Overdredge Right Channel | Overdredge Right Box |
|---|---|---|---|---|---|---|---|---|
| Non-Contour All |
3,109 |
900,000 (100%) 900,000 |
802,800 (100%) 802,736 |
0.0 (100%) 0.0 |
21,900 (100.11%) 21,875 |
200,000 (100%) 200,000 |
197,200 (99.99%) 197,222 |
2,800 (101.82%) 2,750 |
| Contour All | 3,109 (99.49%) 3,125 |
900,000 (100%) 900,000 |
802,800 (100%) 802,736 |
0.0 (100%) 0.0 |
12,000 (96.00%) 12,500 |
200,000 (100%) 200,000 |
189,000 (100%) 188,888 |
0.0 (100%) 0.0 |
| Contour Shoal-Only | 3,109 (99.49%) 3,125 |
900,000 (100%) 900,000 |
802,800 (100%) 802,736 |
0.0 (100%) 0.0 |
12,000 (96.00%) 12,500 |
200,000 (100%) 200,000 |
189,000 (100%) 188,888 |
0.0 (100%) 0.0 |
| Non-Contour Shoal-Only | 3,109 (99.49%) 3,125 |
900,000 (100%) 900,000 |
802,800 (100%) 802,736 |
0.0 (100%) 0.0 |
21,900 (100.11%) 21,875 |
200,000 (100%) 200,000 |
197,200 (99.99%) 197,222 |
0.0 (100%) 0.0 |
1. All of the quantity calculations were very close. The largest difference was 500 ft³ on the Left Box Overdredge for the Contour methods.
2. Wow! Pretty good.
HYPACK® MAX Tests
(Calculated quantities in black; Mathematical prediction in red.)
| Method | Dredge Left Box | Dredge Left Channel | Dredge Right Channel | Dredge Right Box | Overdredge Left Box | Overdredge Left Channel | Overdredge Right Channel | Overdredge Right Box |
|---|---|---|---|---|---|---|---|---|
| Non-Contour All |
3,145 |
900,000 (100%) 900,000 |
802,730 (100%) 802,736 |
0.0 (100%) 0.0 |
21,882 (100.03%) 21,875 |
200,000 (100%) 200,000 |
197,200 (100%) 197,222 |
2,780 (101.09%) 2,750 |
| Contour All | 3,145 (100.64%) 3,125 |
900,000 (100%) 900,000 |
802,730 (100%) 802,736 |
0.0 (100%) 0.0 |
12,545 (100.36%) 12,500 |
200,000 (100%) 200,000 |
188,800 (100%) 188,888 |
0.0 (100%) 0.0 |
| Contour Shoal-Only | 3,145 (100.64%) 3,125 |
900,000 (100%) 900,000 |
802,730 (100%) 802,736 |
0.0 (100%) 0.0 |
12,545 (100.36%) 12,500 |
200,000 (100%) 200,000 |
188,800 (100%) 188,888 |
0.0 (100%) 0.0 |
| Non-Contour Shoal-Only | 3,154 (100.64%) 3,125 |
900,000 (100%) 900,000 |
802,730 (100%) 802,736 |
0.0 (100%) 0.0 |
21,882 (100.03%) 21,875 |
200,000 (100%) 200,000 |
197,220 (99.99%) 197,222 |
0.0 (100%) 0.0 |
Wow! Even a little better than 7.1. These guys really know what they are doing!
ACTUAL DATA TEST: POOLE'S ISLAND RANGE C&D APPROACH CHANNEL
Volumes were calculated using the Contour - All method for single beam data using the HYPACK® MAX and HYPACK® 7.1 VOLUME programs. Data collected with the multibeam system was also processed and volumes computed with the TIN MODEL program. The results are shown below.
|
Method |
Material to Project Depth | Allowable Overdepth | Total Pay Place |
|---|---|---|---|
| Single Beam 7.1 | 81,742 cu.yds. (98.2% of MB) |
51,579 cu.yds. (101.0% of MB) |
133,322 cu. yds. (99.3% of MB) |
| Single Beam MAX | 81,747 cu. yds. (98.2% of MB) |
51,586 cu. yds. (101.0% of MB) |
133,333 cu. yds. (99.3% of MB) |
| Multibeam TIN MODEL | 83,219 cu. yds. | 51,084 cu. yds. | 134,303 cu. yds. |
1. The Single Beam techniques calculated slightly less "Material to Project Depth" and slightly more "Allowable Overdepth". The total material was less than 1% difference from the multibeam survey. This number is small for other tests done in the past. Typically, we have found the difference between single beam and multibeam surveys to yield normally up to 3% more material and sometimes as much as 6%. The above results are probably as close as you are going to see.
TEST: Matrix Cell Size vs. Dredge Quantities
The same edited multibeam data set was gridded at 1'x1', 5'x5' and 10'x10' cell sizes. The resulting XYZ data files were then run through the HYPACK® MAX - TIN MODEL program and volumes were calculated using the Philadelphia Box Cut method. The 1x1 data set contained 979,000 data points.
Computed volumes were:
|
Matrix Cell Size |
Normal Material (cu. yds.) |
Overdrege Material (cu. yds.) |
Total Material (cu. yds.) |
TIN & VOLUME Time to Finish |
|---|---|---|---|---|
| 1 x 1 | 83,173 | 50,969 | 134,142 | 7 hrs 15 min |
| 5 x 5 | 83,219 | 51,084 | 134,303 | 0 hrs 26 min |
| 10 x 10 | 83,305 | 50,978 | 134,283 | 0 hrs 3 min |
1. As shown by previous studies, the increased density of data points does not improve the results of the volume quantities. The longer processing time for dense data sets does not result in significantly different volumes.
Qデータのマージ(結合)(XYZMERGE - Merging topographic data with HYPACK® data)
多くのユーザより、1つに融合された測深データと陸測データを含んでいる断面を描く事を可能にするために、陸測データとHYPACK(TM)データとを融合するための方法を改善するように依頼がありました。これは海岸沿いの測量では重要な事です。
USACE-フィラデルフィアのJoe Scolariのために行った仕事の一部として、私達は現在XYZマージプログラムをリリースしています。このプログラムはHYPACK(TM)MAXに 組み込む予定です。また、HYPACK(TM)メンテナンスプランに加入しているユーザには、要求があればe-mailにてお送りできます。
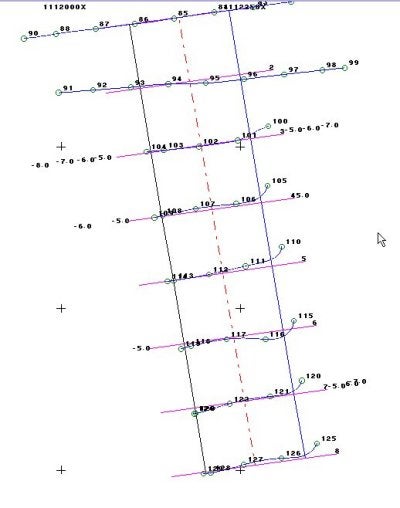
上への図は、陸測データのASCII XYZファイルとともにDESIGN画面に描かれた編集済みのHYPACK(TM)データの航跡が表示されています。ここでの、HYPACK(TM)データはすでにSINGLE BEAM EDITORプログラムにより編集済みのデータですので、これはHYPACK(TM)ALLフォーマットです。
水路の側の黒い数として示されている陸測データは、ASCII XYZデータファイルです。プログラムは、各々のデータラインに他のデータが全くなく、各々のX-Y-ZデータラインがCR-LFによって終わっていれば、スペース区切り、コンマ区切り、または固定されているデータフォーマットのデータを読むことができるはずです。
プログラムを実行します。初めに、上部のブラウズボタンをクリックし、編集済みのHYPACK(TM)LOGファイルの名前を選んでください。次に、下のブラウズボタンをクリックし、ASCII XYZフォーマットで書かれた陸測データのファイルの名前を選んでください。
続いて、新しいデータ用の3文字の拡張子を入力してください。XYZマージプログラムは、既存のHYPACK(TM)データファイルと同じルート名を使って新しいデータファイルを作成しますが、融合されたデータはここで決めた拡張を使いに保存されます。
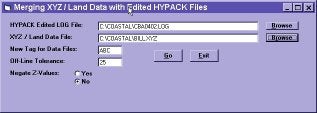
ここで"Off-Line Tolerance"距離(許容距離)を入力してください。XYZマージプログラムは、測線からこの距離以内のどのようなポイントでも新しいデータファイ ルとして割り当てます。陸測データがデータファイルの最初または最後に正しく割り当てられるので連続したデータに再び戻ります。
ユーザは、Z値を反転することも出来ます。例えば陸測データ「5.52」が海図基準面より上方であった場合、"negate Z-value"がYESに設定されていると、それは「-5.52」として保存されます。測深データが下方が正の方向であり、一方では、陸測データが上方が正の方向の時は、この機能が必要です。
設定が終わったら、"Go" ボタンをクリックしてください。1つのファイルあたり数秒で作業が済みます。
QRTK-GPSを使用し水位データ取得をするキネマティックドライバ(New Kinematic Driver for HYPACK® Max)
HYPACK® Maxにあらたなデバイスドライバが追加されました。新しいドライバは、KINEMATIC.DLLです。これのドライバは、これまでのKIN.DLLとTRIMKIN.DLLにおき変わるもので、リアルタイムに潮位を得るために使用されます。
使用方法は、Hardware - Devices - Add Deviceで "Kinematic GPS (Real- Time- Tides) を選択します。
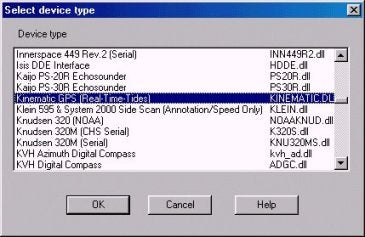
Figure 1
セットアップ方法は今までのドライバと同じです。(詳細は説明書を参照してください。)唯一の違いは、NMEAスタンダードキネマティックGPSとの互換性のためにNMEA-GGKのチェックボックスが追加されたことです。
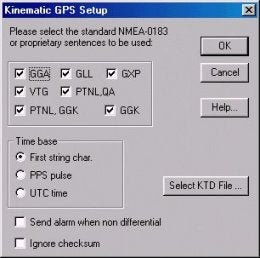
Figure 2
Qカタログファイルの操作(Working with Catalog Files (*.LOG))
HypackMaxが自動で作成するものと異なるカタログファイルが必要となるかもしれません。その場合は以下のような手順で簡単に新しいカタログファイルが作成編集等が行なえます。
DataFileList 内のProjectDataフォルダで右クリックしてドロップダウンメニューから「CREATE NEW LOG FILE」を選択します。すると、データフォルダ内の全データファイルリストのダイアログが表示されます。
Creating a New Catalog File (Before)
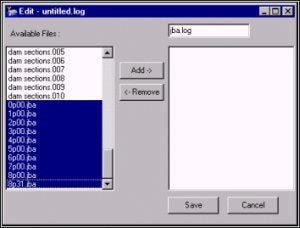
右上角のボックスに新しいログファイルの名前を入力します。
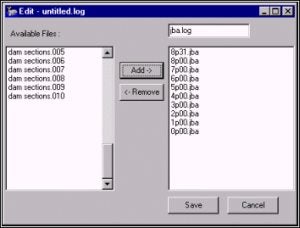
ログファイルに入れたいデータファイル名を選択し、「Add」ボタンをクリックします。HYPACK MAXは最初に選んだフォルダ(Raw・Edit・Sort)に、この作成されたファイルを拡張子LOGで保存します。
Creating a New Catalog File (After)

カタログファイルの編集
The Edit Log File Dialog
DataFileList 内のProjectDataフォルダで右クリックしてドロップダウンメニューから「EDIT NEW LOG FILE」を選択します。すると、カタログ内のファイルのリストとプロジェクト内で操作できるその他のファイルのダイアログが表示されます。
カタログ内のファイルリストから選択して「Remove」をクリックすることによってリストから測量ファイルを削除できます。
操作可能な測量ファイルを選択し、「Add」をクリックすることによってファイルをリストに加えることができます。
カタログファイルの合成(現在、使用不可)
データファイル内のカタログファイルまたはデータファイルフォルダで右クリックすると、メニューに一組の合成機能のリストが現れます。現在の時点ではこの機能は正常に働きません。従って、この機能で新規にファイルは作成しないでください。
Qローカル座標使用時にSurvey画面に表示される船の向きをグリッドと合わせる
下図のようにローカル・グリッドを回転(Rotation)させた場合、計画測線(LNW)やマトリクス(MTX)はこのローカル・グリッドの設定に基づいて作成されます。
しかし、方位センサからのデータは マグネティック方位を出力しているだけです。
ローカル・グリッドを使用する時には、下図のように方位センサの"Yaw"オフセット(度単位)にもローカル・グリッドの回転角を設定して下さい。
QTINモデルプログラムでの緯度経度水深データの利用(Importing Longitude-Latitude-Depth Data Into TIN MODEL)
最近、あるユーザーよりTinモデルプログラムにあるファイルを読み込ませるとプログラムがクラッシュしてしまうとの連絡を受けました。
-1.1492601 50.8352175 -7.25 L11.0852
-1.1492601 50.8352175 -7.25 D11.0852
-1.1492575 50.8352196 -7.23 L11.0853
-1.1492575 50.8352196 -7.23 D11.0853
-1.1492560 50.8352210 -7.18 L11.0854
-1.1492560 50.8352210 -7.18 D11.0854
-1.1492536 50.8352228 -7.02 L11.0855
-1.1492536 50.8352228 -7.02 D11.0855
-1.1492518 50.8352243 -7.03 L11.0856
-1.1492518 50.8352243 -7.03 D11.0856
-1.1492498 50.8352243 -7.08 L11.0857
-1.1492498 50.8352243 -7.08 D11.0857
-1.1492493 50.8352253 -6.93 L11.0858
-1.1492493 50.8352253 -6.93 D11.0858
-1.1492491 50.8352270 -7.00 L11.0859
-1.1492491 50.8352270 -7.00 D11.0859
-1.1492471 50.8352280 -7.00 L11.0900
上記のファイルを見ていただくと分かるように、XYZファイルではなく緯度、経度、測深値のファイルとなっています。TINモデルプログラムではX-Y ファイルと同様に緯度、経度のファイルを取り扱うこともできます。このファイルを扱うと、Tinモデルを生成している途中でプログラムはハングアップしま す。Tinモデル内部では0.01を最小単位として計算を実行しています。従って、上記ファイルの場合、全ての値が-1.14と50.83として読み込ま れてしまうため全て同一点となりTinが生成できなくなってしまいます。
この問題を解決するためには、Excelやエディタなどを使用して緯度、経度の値を100000倍に変換します。
-114926.01 5083521.75 -7.25
-114926.01 5083521.75 -7.25
-114925.75 5083521.96 -7.23
-114925.75 5083521.96 -7.23
-114925.60 5083522.10 -7.18
-114925.60 5083522.10 -7.18
-114925.36 5083522.28 -7.02
-114925.36 5083522.28 -7.02
-114925.18 5083522.43 -7.03
-114925.18 5083522.43 -7.03
-114924.98 5083522.43 -7.08
-114924.98 5083522.43 -7.08
-114924.93 5083522.53 -6.93
-114924.93 5083522.53 -6.93
-114924.91 5083522.70 -7.00
-114924.91 5083522.70 -7.00
-114924.71 5083522.80 -7.00
上記の様に変換することでTinモデルでの処理が可能となります。ただし、この様に処理したデータでコンタや体積計算を実行しても正常な結果は得られません。
QTINモデルにおけるフィラデルフィア法体積計算(Implementing of Philadelphia Post-dredge Method in TIN Model)[英語]
Overview: Over the last couple of years, the use of multibeam echosounders for dredge payment surveys has become more common. Users have requested the ability of using all of the multibeam sounding data when computing volumes over an area.
Late last year, Lazar Pevac adapted the TIN MODEL program of HYPACK® MAX to be able to compute the volumes of a survey surface versus the template information in a planned line file (*.LNW). The Philadelphia District of the U.S. Army Corps of Engineers funded this work. The advantage of this method over previous methods was that it provided volume quantities for both dredge and overdredge templates and provided quantities for each pair of lines, breaking it down into left slope (or box), left of channel, right of channel, right slope (or box).
The last step of this development project was to be able to perform a pre-dredge versus post-dredge calculation in the TIN MODEL. Lazar has just completed this task and it is now available for interested users. It was not done in time for the 00.5 release CD, but is available from customer support. A description of the method is shown below.
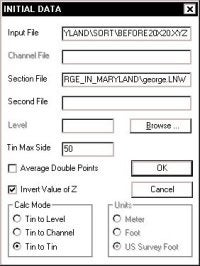
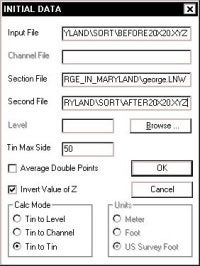
Start-up: There is nothing really new on starting the TIN MODEL program. When you are asked to enter your file information, you can specify a single file for a pre-dredge computation or two files for a pre-dredge versus post-dredge computation.
The figure (shown upper right) shows the layout for a single data file to be used in a pre-dredge computation. The figure (shown lower right) shows the layout for two data files and will result in a pre-dredge versus postdredge computation.
In both cases, we have included a planned line file (*.LNW: created in CHANNEL DESIGN). This planned line file will be used to determine the location of the lines and the dredge templates for each line.
In both cases we have checked the "Invert Value of Z" box. You want to do this if you are entering XYZ data. If I were using single beam data, I would not check this box. TIN MODEL will then correctly interpret the data.
You need to have the Tin to Tin method checked in the lower left hand corner in order to enter the Second File (Post-Dredge survey data).
If you are doing a Pre-dredge versus Post-Dredge computation, you should enter the filename with your Pre-Dredge data as your "Input File" and the filename with your Post-Dredge data as your "Second File".
Once you click the OK button, the TIN MODEL program will start with the first file and create the surface model. It will immediately go to the second file and create a surface model. Control will then be returned to the operator.
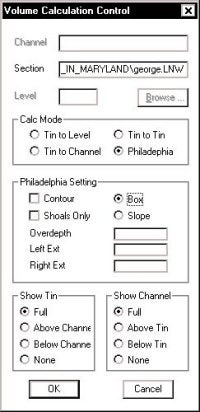
Set Method: The user should next go to the Calculate - Set Method menu item. There have been a couple of minor changes to the window.
The Planned Line file (*.LNW) specified during the initial window will appear as the "Section" file. This can be changed at any time before computing the volumes.
Under the "Calc Mode" frame, there is now just a Philadelphia choice. If you have specified only a single input data file, the program will provide a pre-dredge computation. If you have specified two input data files, the program will provide a pre-dredge versus post-dredge report. There is no way to over-ride this.
The type of Philadelphia computation can be either a Box or Slope. This check box has been moved into the "Philadelphia Setting" frame. If the user selects "Box", they must then enter the depth of the overdredge template beneath the design template, along with the extension distances for the box on the left and right sides.
If the user selects "Slope", all they have to specify is the depth of the overdredge template beneath the design template.
Once you have entered your settings, click OK to return to the main menu. Then click Calculate - Volumes to start the computation.
Computation Sequence: The TIN MODEL program is going to go through three computation stages:
- Compute Philly Volumes for Input File and Second Files .
- Generate a 3rd Surface that is the Differences Between Surfaces.
- Compute a Tin to Tin volume on the New Surface.
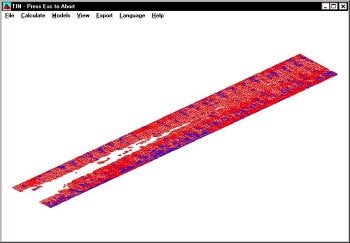
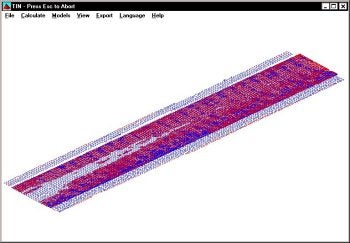
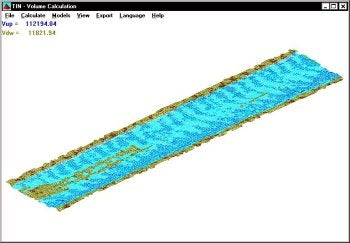
The image to the left shows the program after the first stage. It has computed the Philly volume information for each data set. The image on the right shows the program at the end of phase 2. It has computed a new surface by determining the separation between the original two surfaces.
In the figure to the right, the program has completed phase 3. This is the TIN-to-TIN computation. It is used to determine the total amount of material removed (regardless of the template) and the total of material "infilled" during the dredging process. These are areas where the bottom in the Post-Dredge data is shoaler than the Pre-Dredge data.
Before performing the TIN-to-TIN computation, the program "clips" the data to the borders of the Planned Line File (*.LNW). This is to prevent it from including material outside the area of interest in this computation.
The Pre-Dredge versus Post-Dredge report is then generated and can be viewed or printed from the Export menu. The report lists the quantities for each pair of survey lines. It shows the amount of material available after the pre-dredge survey, the amount of material remaining after the post-dredge survey and takes the difference between the two to obtain the material removed.
The summary for the computation is shown in the figure right. A description of each item is provided below.
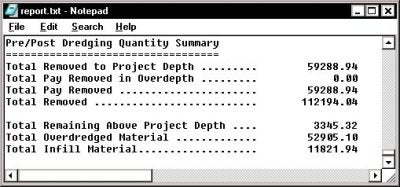
Total Removed to Project Depth: This is the total material above the dredge template from the pre-dredge survey minus the total material above the dredge template from the post-dredge survey.
Total Pay Removed in the Overdepth: This is the total material available in the overdredge template area from the pre-dredge survey minus the total material available in the overdredge template from the post-dredge survey.
Total Pay Removed: This is the sum of the above two items.
Total Removed: This is the total material removed between the pre-dredge and post-dredge surveys, without respect to the templates. It would include any material removed beneath the overdredge template that would not be included in the Total Pay Removed quantity.
Total Remaining Above Project Depth: This is the amount of material computed from the Post-Dredge survey that is above the design template. The pre-dredge survey is not used when computing this number.
Total Overdredged Material: This is the Total Removed less the Total Pay Removed.
Total Infill Material: This is the volume of material where the depth of the Post-dredge survey is shoaler than the Pre-dredge survey.
Q各センサーオフセット入力の詳細(Hardware Offsets and Origins)[英語]
We often get questions from users who are configuring their hardware and are getting lost in the maze of variables to consider in determining the origin, and changing offset signs. The key below is written to help guide you with these questions. Here's how it works.
Choose the first outline level that fits your setup. Now, under that heading, choose the second level heading that describes your setup. Continue progressing down through the headings until a setup table follows your last choice.
The setup table tells you what to use for the origin, which Hardware program each device should be entered in, and the signs used for the offset measurements.
Note: In all setups, except for the GPS, latency is usually zero. You may enter a value initially from the GPS manual or start with it at zero, but you should run a Patch Test and adjust this setting accordingly. Sonar systems usually automatically compensate for latency. Latency is not an issue for MRUs and Gyros.
I. Single Vessel
A. Gyro for heading
1. Single Beam
| Consideration | Solution |
|---|---|
| Origin |
Transducer
|
|
Hardware Setup Program(s)
|
Hypack Hardware- All devices
|
| Offset Signs & Program(s) |
Horizontal offsetsare positive forward and starboard Z offsets: Transducer: 0--included in draft correction of device when calibrated GPS: Positive upward |
2. Multibeam
There are two possible options for setting up multibeam systems. Solution A maintains the origin always at the vessel's pivot point. Solution B uses the transducer head as the origin in Hypack®Hardware, while Hysweep®Hardware uses the vessel's pivot point. In this case, the helmsman display data is based on the transducer, enabling more accurate positioning of the transducer over the survey line.
Note also, in most cases, the rotational offsets of the gyro and MRU are calibrated during installation to the vessel. Any additional error will be compensated for by the Patch Test values that are then applied to the transducer.
| Consideration | Solution A |
|---|---|
| Origin |
|
| Hardware Setup Program(s) |
Hysweep Hardware-MRU, Transducer, Gyro, Hypack.dll |
| Offset Signs & program(s) |
Horizontal offsets: positive forward and starboard of the origin. Z offsets: Transducer: 0--included in draft correction of device when calibrated. GPS: Positive upward from the waterline in Hypack®Hardware; positive downward in Hysweep®Hardware. MRU: For MRUs use zero.** Yaw Offset: Transducer (Determined in Patch Test.): positive for clockwise rotation from alignment with the keel. Gyro*: Usually zero. May add correction for variation between magnetic N and true N. Add the variation to the mounting offset using positive values for clockwise rotation from alignment with the keel. MRU*: positive for clockwise rotation from alignment with the keel. Pitch offset (Determined in Patch Test.): Multibeam sensors not oriented directly below the vessel. Positive forward. Roll offset (Determined in Patch Test.): Multibeam sensors and MRUs* not oriented directly below the vessel. The reference roll angle (in decimal degrees) is 0 for vertical mounting positive to the port side. |
| Additional settings |
If MRU is not at the vessel pivot point, when you edit your data, check Correct for Induced Heave in the Advanced Read Parameters dialog.
|
| Consideration | Solution B |
|---|---|
| Origin |
Hypack Hardware: Transducer
Hysweep Hardware: Vessel pivot point-ideal MRU position |
| Hardware Setup Program(s) |
Hypack Hardware-GPS, Hysweep.dll (optional)
Hysweep Hardware-Transducer, MRU, Gyro, Hypack.dll |
| Offset Signs and program(s) |
Horizontal offsets: positive forward and starboard of the origin. Z offsets: GPS: Positive upward from the waterline in Hypack®Hardware, positive downward in Hysweep®Hardware. Transducer: 0--included in draft correction of device when calibrated. MRUs use zero**. Yaw Offsets: Transducer (Determined in Patch Test.): positive for clockwise rotation from alignment with the keel. Gyro*: Usually zero. May add correction for variation between magnetic N and true N. Add the variation to the mounting offset using positive values for clockwise rotation from alignment with the keel. MRU*: positive for clockwise rotation from alignment with the keel. Pitch offset: For multibeam sensors (determined in Patch Test.) and MRUs* not oriented directly below the vessel. Values are positive forward. Roll offset: Multibeam sensors (determined in Patch Test) and MRUs* not oriented directly below the vessel. The reference roll angle (in decimal degrees) is 0 for vertical mounting. Values are positive to the port side. |
| Additional settings |
If the MRU is not at the vessel pivot point, when you edit your data, check Correct for Induced Heave in the Advanced Read Parameters dialog of the editor.
|
3. Multiple Transducer
a) System supported in Hypack Hardware.
| Consideration | Solution |
|---|---|
| Origin |
Vessel pivot point-ideal MRU position
|
| Hardware Setup Program(s) |
Hypack Hardware-all devices
|
| Offset Signs & program(s) |
Multitransducer offsets are entered in the Transducer Offsets Program. Horizontal offsets: positive forward and starboard of the origin. Z offsets: GPS & Transducer: positive upward from the waterline. MRU: Use zero.** Yaw Offset Gyro*: Usually zero. May add correction for variation between magnetic N and true N. Add the variation to the mounting offset using positive values for clockwise rotation from alignment with the keel. |
b) System supported in Hysweep Hardware
| Consideration | Solution |
|---|---|
| Origin |
Vessel pivot point-ideal MRU position
|
| Hardware Setup Program(s) |
Hypack®Hardware: GPS, Hysweep.dll (optional)
Hysweep®Hardware: Transducers, Gyro, MRU, Hypack.dll |
| Offset Signs & program(s) |
Hypack®Hardware:
Horizontal offsets: positive forward and starboard of the origin. Z offsets: GPS: positive upward from the waterline. Hysweep®Hardware:·Horizontal offsets: positive forward and starboard of the origin. Z offsets: GPS in Hypack.dll is positive downward. Transducer: positive downward from the waterline. MRU: Use zero.** Yaw Offset: Gyro*: Usually zero. May add correction for variation between magnetic N and true N. Add the variation to the mounting offset using positive values for clockwise rotation from alignment with the keel. |
4. Single Beam and Multibeam
| Consideration | Solution |
|---|---|
| Origin |
Hypack®Hardware: Transducer most important over survey line.
Hysweep®Hardware: vessel pivot point |
| Hardware Setup Program(s) |
Hypack®Hardware: GPS, Single beam Transducer, Hysweep.dll (required--passes heading to Hypack®Survey)
Hysweep®Hardware: Multibeam Transducer, MRU, Gyro, Hypack.dll (passes position to Hysweep®Survey) |
| Offset Signs and program(s) |
Hypack®Hardware:
Horizontal offsets: positive forward and starboard of the origin. Z offsets: Positive upward from the waterline. Hysweep®Hardware: Horizontal offsets: positive forward and starboard of the origin. Z-offsets: GPS in Hypack.dll is positive downward. Transducer: 0--included in draft correction of device when calibrated. MRU: Use zero.** Yaw Offsets: Transducer (determined in Patch Test) & MRU*: positive for clockwise rotation from alignment with the keel. Gyro*: Usually zero. May add correction for variation between magnetic N and true N. Add the variation to the mounting offset using positive values for clockwise rotation from alignment with the keel. Pitch offset: Multibeam sensors (Determined in Patch Test) and MRUs* not oriented directly below the vessel. Positive forward. Roll offset: Multibeam sensors (determined in Patch Test) and MRUs* not oriented directly below the vessel. The reference roll angle (in decimal degrees) is 0 for vertical mounting-use values positive to the port side. |
| Additional settings |
If MRU is not at the vessel pivot point, when you edit your data, check Correct for Induced Heave in the Advanced Read Parameters dialog.
|
5. 2 Single Beam Systems
| Consideration | Solution |
|---|---|
| Origin |
The transducer that is most important to keep over your survey line.
|
| Hardware Setup Program(s) |
Hypack Hardware- All devices
|
| Offset Signs & program(s) |
Horizontal offsets are positive forward and starboard Z offsets: Transducer: 0--included in draft correction of device when calibrated GPS: Positive upward |
B. GPS for heading (1or 2)
If you are using 2 GPS and OTFGYRO.dll, the forward GPS is the origin and is the only one where latency offsets should be applied.
1. Single Beam
| Consideration | Solution |
|---|---|
| Origin |
GPS
|
| Hardware Setup Program(s) |
Hypack Hardware- All devices
|
| Offset Signs & program(s) |
Horizontal offsets are positive forward and starboard Z offsets: Transducer: 0--included in draft correction of device when calibrated GPS: Positive upward |
2. Multibeam -- not recommended
3. Multi-transducer
The origin is at the GPS. All else is the same as multitransducer systems with a Gyro.
4. Single beam and Multibeam-not recommended
5. 2 Single beam
The origin is at the GPS. All else is the same as multitransducer systems with a Gyro.
II. Multiple Vessels
A. Towfish
Towfish Offsets and Measurements
Offsets for any devices on the vessel are measured from the vessel origin.
The cablecnt.dll and towcable.dll in Hypack®Hardware uses the towfish depth, Z?offset and corrected cable length to calculate the horizontal distance from the A?frame connection point to the towfish. That distance is added to the Y?offset to calculate the layback.
Offsets on the Towfish are from the connection point of the cable to the towfish. The hopper arms on a dredge are also configured with reversed horizontal offsets and from the connection point of the arm.
Note: When configuring offsets for the cablecnt.dll or towcable.dll, and the Towfish or other Mobiles in the Hypack®Hardware program, regardless of what type of mobile you have, port and starboard offsets specified in the Offsets dialog must have their signs reversed from the way you normally express offsets for other devices.
| Measurements | Normal Device Offsets | Mobile Offsets |
|---|---|---|
| Port and Aft | Negative | Positive |
| Starboard and Forward | Positive | Negative |
The example below illustrates a towfish setup
| Towfish with Simple Layback | |||
|---|---|---|---|
 |
Devices | Dialogs | |
| Driver Setup | Offsets | ||
| GPS | Starboard -5
Forward -5 Height antenna height (not shown) |
||
| Cablecnt.dll or Towcable.dll | Y Offset -20
Z Offset=height above water (not shown) |
Starboard -5
Forward 0 Height 0 |
|
| Towfish Device | Starboard 0
Forward -10 |
||
| Cable out is controlled in the Survey program. | |||
Note: In this example, it is also correct to use the following settings for the Cablecnt.dll or Towcable.dll.
| Devices | Driver Setup | Offsets |
|---|---|---|
| Cablecnt.dll or Towcable.dll | Y Offset 0
Z Offset = height above water (not shown) |
Starboard -5
Forward 20 Height 0 |
The Track point systems calculate the towfish position. No towfish offsets or cable out distances are required.
| Track Point Systems | |||
|---|---|---|---|
 |
Devices | Dialogs Offsets | |
| GPS | Starboard -5
Forward -5 Height antenna height (not shown) |
||
| Track point | Starboard -10
Forward 20 Height 0 |
||
| Dredge Systems | |||
|---|---|---|---|
 |
Devices | Dialogs Offsets | |
| Hopper Arm #1 | Starboard 12
Forward -10 |
||
| Hopper Arm #2 | Starboard -4
Forward 10 |
||
B. Independent Multiple Vessels
A central vessel can track multiple vessels via radio modems. Set up the devices on each vessel individually. The NMEA.dll can be setup to output GGA, VTG and DBT messages via the radio modem to the data collection vessel. You can also use the Shared Memory NMEAOUTPUT program to send the desired data to the collection vessel. If you will be tracking more than one vessel in this manner, the radio modems must be of different frequencies so that the collecting computer can differentiate between devices.
The data collection vessel will have a NMEA.dll configured for each incoming message to receive the data and record data from each sensor separately. The survey screen on the collection vessel can display all of the vessels from which it is receiving data.
QDesignプログラムで作成した測線(LNW)がSurveyプログラム上で現在の船の位置と異なった場所に表示される
下記の点を確認してください。
測線(LNW)を作成する時のXY座標の入力は合っていますか?
HYPACKでは、南北が"Y"、東西が"X"の数学座標を使用しています。(下図参照)
測線(LNW)を作成した時の測地の設定(Geodetic Parameter)とSurveyで使用している測地の設定は一致していますか?
Q緯度経度表示への切替と入力機能(Changes to Lat-Long Display and Input Functions)
HYPACKR MAX には、X-Y座標からローカルの緯度経度へ、さらにWGS-84の緯度経度に変換する手順が幾つか有ります。我々は何人かの顧客との長い議論の末に、 WGS-84以外のローカル座標上に緯度経度を表示するために使われている多くの機能を変更しなくてはならないとの結論に達しました。これらの変更は、 バージョン00.5A CD以降のものに反映されています。これ以前のバージョンに対しては、Tech Supportサイトから最新版のHYPACK.EXEとDRAW32A.DLLをダウンロードする事でアップデート可能です。
以下の表示個所にこれらの変更が反映されています:
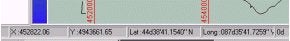
HYPACKR MAX スクリーン内のカーソル位置の緯度経度表示。
HYPACKR MAX スクリーンの画面下には、カーソル位置のX-Yや緯度経度が表示されている。前のMAXのバージョンでは、これはWGS-84の緯度経度が表示されている。DRAW32A.DLL をダウンロードして \HYPACK ディレクトリにコピーする事によってローカルの緯度経度で表示する事が可能になります。
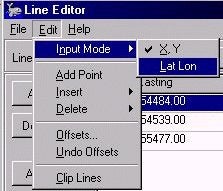
Line Editorプログラムでの緯度経度表示。
多数のユーザは、Line EditorでのWaypointをX-Y(Default)か緯度経度の何れかで入力可能であるという事に気づいていませ ん。00.5Aより古いバージョンでは、WGS-84の緯度経度で入力しなくていけませんでした。DRAW32A.DLLをダウンロードし¥HYPACK ディレクトリにコピーする事によって、ローカルに基づいた緯度経度の情報を入力する事ができるようになりました。
別の変更点としては、Input ModeがLat-Longに設定されている時は、分解能が向上します。00.5A以前のバージョンでは、DDD-MM.MMMM のフォーマットで緯度経度を入力しなければならなく十分な精度が得られませんでした。
図に示す様にフォーマットがDDD-MM-SS.SSSS に変更されました。この変更を反映させる為には、Tech Support ページから最新版のHYPACK.EXE をダウンロードし、それを\HYPACK ディレクトリにコピーします。
MAXとSURVEYでの緯度経度 グリッドの表示。5A以前のバージョンでは、MAX SURVEY画面に表示される緯度経度 グリッドはWGS-84のグリッドです。
DRAW32A.DLLをダウンロードする事によって、両方のプログラムでローカル座標での緯度経度 グリッド表示が可能となります。