FAQ
HYPACKに関する質問
13.ボリューム---体積計算(Volumes)
ID.Q13-19
Q. シングルビームデータと体積計算について(The Effect of "Along-Line" Spacing of Soundings in Single Beam Data on the Computation of Average End Area Volumes)[英語]tion of Average End Area Volumes
A.
Well, that's a hell of an impressive title. If I were to tell you of a way that you could make $20,000 without any additional effort would you be interested? If I tell you how, would you give me half? If your answer to the last two questions is "Yes", then read on. Otherwise, go look at the cartoon.
HYPACK® can collect every sounding that comes out of your echosounder. If your sounder is updating at 15 times per second and your boat is traveling at six knots, this means you will have a sounding every 8" along your planned line.
Now, when you go to compute volumes, should you use all of these soundings or should you "thin" the data by using one of the sounding selection programs?
In preparation for my Volume Seminar at the 2001 U.S. Hydrographic Conference (21-24 May 2001 - Sheraton Norfolk Waterside Hotel - details at www.thsoa.org) I took a single beam data set and did some tests to determine how the volumes compared when I thinned the data using different spacings.
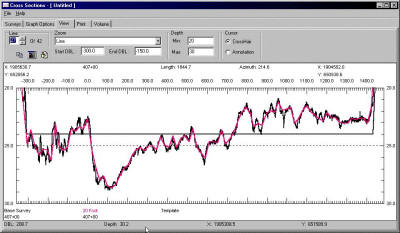
Below is a plot, taken from a capture of the CROSS SECTIONS program. The original survey data is spaced about every 8" and is in black. I then ran the data through the MAPPER program, using a 20' x 20' matrix and saved the point "Closest to the Center" of each cell to an XYZ file. [It's a little more complex, as I then took the XYZ file result from MAPPER, ran it into the TIN MODEL and then cut sections through it to get it back into EDITED ALL format so I could then load the results back into CROSS SECTIONS.] The soundings at 20' spacing are shown in red on the picture below.

Visually, there isn't a whole lot of difference between the two sections. The file with the 8" spacing moves above and below the file with the 20' spacing, but it's not evident what the effect will be on the volumes.
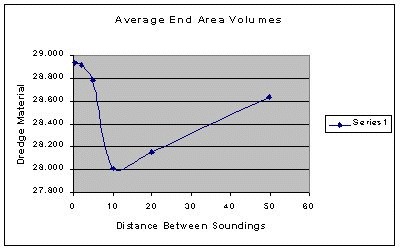
I ran volume quantities for the entire channel, once for the 8" data and again for the 20' data. The 8" data had almost 3% more material. I then ran some more tests, sampling the data at 2', 5', 10', 20' and 50' spacing to see the result. The computed volumes are summarized in the table and graph below.
| Spacing | Dredge Material (cubic yards) |
% of original |
|---|---|---|
| 8" | 28,938 | 100 |
| 2' | 28,911 | 99.9 |
| 5' | 28,782 | 99.5 |
| 10' | 28,009 | 96.8 |
| 20' | 28,151 | 97.3 |
| 50' | 28,630 | 98.9 |

The test conducted on this data set was repeated on a different data set with almost identical results.
So, if I want to maximize my volume quantities, I will use every data point in the sounding set. If I want to minimize my volume quantities, I will thin the data every 10' along the line.
The difference in this data set between those two approaches is 929 cubic yards. At $22/yard, that comes to a savings of $20,438.