HYPACKに関する質問
14.ティンモデル---3次元成果(TIN Model)に関するFAQ
QTINモデルプログラムでの緯度経度水深データの利用(Importing Longitude-Latitude-Depth Data Into TIN MODEL)
FAQ ID:Q14-1
最近、あるユーザーよりTinモデルプログラムにあるファイルを読み込ませるとプログラムがクラッシュしてしまうとの連絡を受けました。
-1.1492601 50.8352175 -7.25 L11.0852
-1.1492601 50.8352175 -7.25 D11.0852
-1.1492575 50.8352196 -7.23 L11.0853
-1.1492575 50.8352196 -7.23 D11.0853
-1.1492560 50.8352210 -7.18 L11.0854
-1.1492560 50.8352210 -7.18 D11.0854
-1.1492536 50.8352228 -7.02 L11.0855
-1.1492536 50.8352228 -7.02 D11.0855
-1.1492518 50.8352243 -7.03 L11.0856
-1.1492518 50.8352243 -7.03 D11.0856
-1.1492498 50.8352243 -7.08 L11.0857
-1.1492498 50.8352243 -7.08 D11.0857
-1.1492493 50.8352253 -6.93 L11.0858
-1.1492493 50.8352253 -6.93 D11.0858
-1.1492491 50.8352270 -7.00 L11.0859
-1.1492491 50.8352270 -7.00 D11.0859
-1.1492471 50.8352280 -7.00 L11.0900
上記のファイルを見ていただくと分かるように、XYZファイルではなく緯度、経度、測深値のファイルとなっています。TINモデルプログラムではX-Y ファイルと同様に緯度、経度のファイルを取り扱うこともできます。このファイルを扱うと、Tinモデルを生成している途中でプログラムはハングアップしま す。Tinモデル内部では0.01を最小単位として計算を実行しています。従って、上記ファイルの場合、全ての値が-1.14と50.83として読み込ま れてしまうため全て同一点となりTinが生成できなくなってしまいます。
この問題を解決するためには、Excelやエディタなどを使用して緯度、経度の値を100000倍に変換します。
-114926.01 5083521.75 -7.25
-114926.01 5083521.75 -7.25
-114925.75 5083521.96 -7.23
-114925.75 5083521.96 -7.23
-114925.60 5083522.10 -7.18
-114925.60 5083522.10 -7.18
-114925.36 5083522.28 -7.02
-114925.36 5083522.28 -7.02
-114925.18 5083522.43 -7.03
-114925.18 5083522.43 -7.03
-114924.98 5083522.43 -7.08
-114924.98 5083522.43 -7.08
-114924.93 5083522.53 -6.93
-114924.93 5083522.53 -6.93
-114924.91 5083522.70 -7.00
-114924.91 5083522.70 -7.00
-114924.71 5083522.80 -7.00
上記の様に変換することでTinモデルでの処理が可能となります。ただし、この様に処理したデータでコンタや体積計算を実行しても正常な結果は得られません。
Qコンターにラベルを付加する(Labeling Contours in the TIN program)
FAQ ID:Q14-2
CADを使用する場合にこの機能を使用します。プログラムを使用する場合は、Hyplotプログラム内で同様の機能が実行できますので、特に使用する必要はありません。
操作方法は以下の通りです。To get contours labeled you need to perform the following steps.
- dxf exporを使用しコンターとラベルを別々のファイルに保存します。
- Label Contoursを選択すると以下のダイアログが表示さます。
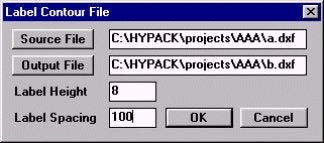
- Source(作成元)ファイルを選択します。
- Output(出力)ファイル名を決定します。
- ラベルの大きさと間隔を設定します。単位はmです。
- OKボタンをクリックして完了です。
ラベル付コンタ例
Q任意のラインで断面を生成する(Exporting Sections from the TIN Program)
FAQ ID:Q14-3
Tinモデルプログラムから断面ファイルを出力する方法は2通りあります。Tinモデルプログラムでは断面を生成する基準としてLineEditorプログラムで作成するLNWファイルまたはAdvanced Channel Designerプログラムで作成するCHNファイルを使用します。
1つ目の方法はALL format Exportを使用する方法です。この場合、Single Beam Editorプログラムと同様にログファイルが生成されます。 Cross Sectionsプログラムで体積計算などを行う場合はこの方法を選択してください。この方法で断面ファイルを作成した場合は、Cross SectionsプログラムのMax DBL Gapに注意してください。TIN Max SideよりMax DBL Gapの値が小さいとその中にはデータが何もなくなってしまうからです。
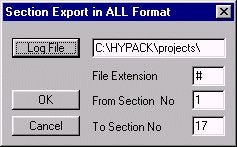
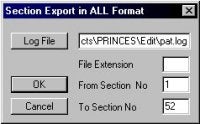
All Formatstart Exportの使用方法は以下の通りです。
ログファイル名をつけ、拡張子(File Extension)の設定を行います。#を入力すると、断面番号と同じ拡張子となります。#以外の文字を入力した場合はファイル名が断面番号になります。
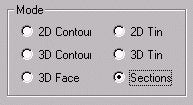
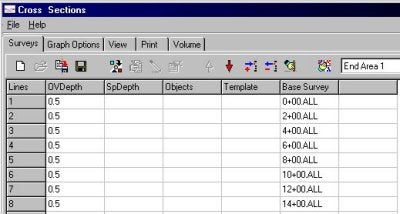
2つ目の方法はDXF Exportを使用する方法です。作成した断面ファイルを利用して計算などを行わない場合はこの方法が適しているでしょう。DXF Export ダイアログボックスで 'Sections' を選択することで断面ファイルのDXF出力が可能になります。各々の断面が異なるレイヤーとして作成されます。
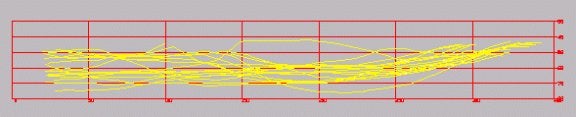
The picture below is an example of DXF Sections Export.
QTINモデルで現在使用しているXYZデータに適したマトリックスファイルを作成する
FAQ ID:Q14-4
Matrix Exportに加えられた新しいオプションがあります。
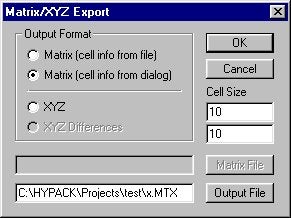
このオプションによりマトリックス(*.MTX)テンプレートファイルを必要とせずに、マトリックスセルサイズを入力するだけでTINプログラムは、自動的に幅、高さ、及び、回転を計算します。
セル形が矩形であるならば、長辺側は、マトリックスの長辺側に自動的にマッチングされます。
下の図は、XYZファイル、及び、と作成したマトリックスファイル( 10x10セルサイズ)です。
QTINモデルプログラムのDXFファイル出力機能(New features in TIN DXF Export)
FAQ ID:Q14-5
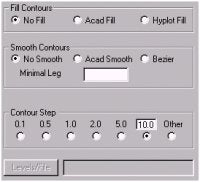
TinモデルプログラムメニューのExport-DXF Formatを選択します。ファイル名入力後、各設定を行い、OKボタンをクリックすると変換が実行されます。
- Fill Contours のAcad Fillは塗りつぶされたエリアを直接AutoCAD、または、MicroStationチャートに出力することが可能となります。データをプロッタに輸出するためにHyplotプログラムを使うならば、Hypolt Filを選択してください。
- Smooth Contoursには、2つの選択肢があります。Acad Smoothは AutoCAD互換のB‐スプライン、Bezierは Bezierスプラインを作成します。また、Minimal Legで設定される値により、プログラムは、この数未満の長さのセグメントを生成しません。それにより、出力ファイルを更に小さくし、そして、平滑化効果を向上させることができます。
- Contour Stepによってコンターの間隔を設定することができます。
QTINモデルプログラムの差分比較機能(Tin Model XYZ Diff Feature)
FAQ ID:Q14-6
32-bit Tin Modelプログラムに新機能が追加されました。この新機能は、2つのTINモデル間の差分深度を計算し、XYZ形式のファイルとして出力することを可能にします。
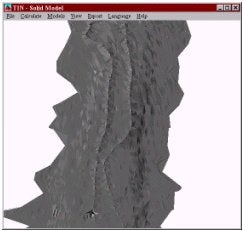
下の2つの地形図は、ニューイングランド工兵隊がマルチビーム測深機により収録されたデータを使用して作成したsolid TIN モデルです。工兵隊は、ケープコッドの航路において同一のエリアを別々の時期に調査を行いました。
1度目の調査は1998の10月に、2度目の調査は1999年の3月に行われました。
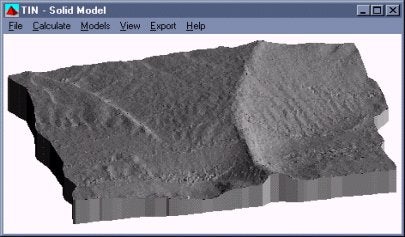
October 1998 Survey
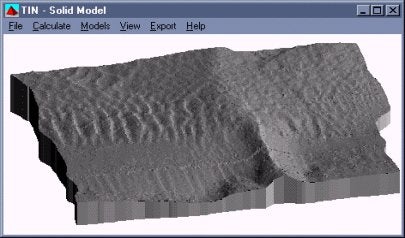
March 1999 Survey
プロットされたものを比べると、航路内のかなり砂が移動していることが分かります。この差を求めれば、砂の移動量がわかります。実際の操作は下記の通りです。
新しいTINを作成する際、calc mode選択でTin to Tinチェックボックスにチェックをします。1つ目のデータセットをInput Fileとして、また2つめのデータセットをSecond Fileとして読込みます。TINを作成した後、ExportメニューのMatrixメニューをクリックし、 XYZ Diffボタンをクリックします。output fileの名前を入力し[OK]ボタンをクリックします。Tin Modelプログラムは、input fileのXとYの位置を使用して、2つの表面間のZ値の差を計算し、新しいXYZファイルを作成します。
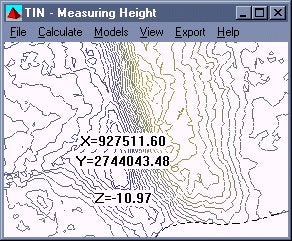
上記の様にして、新たに作成されたXYZファイルを得る事ができ、それを使用して新しいTinを作成できます。そして、コンタ-出力や深度の変化をプロッ トする事が出来ます。下の2Dコンタ-図は、1998年の10月と1999年の3月に行われた2つの調査のデータセットを使用して作られたものです。 XYZ view機能を使用し5ヶ月の間にいくつかの場所で10フィートもの深度の変化が確認されます。
この新しいアップデートは、現在メンテナンスプランに加入中の全てのユーザが入手可能ですので、東陽テクニカにお問い合わせ下さい。
QTINモデルプログラムのコンター出力機能(Exporting Contours from TIN Program)
FAQ ID:Q14-7
TINプログラムは、DXFフォーマットを使うコンター出力を可能にします。全てのHYPACKがプログラムを関連づけ、その上AutoCad、及び、Microstation DesignがDXFファイルを読むことができるため、重大な意味のある制限は皆無に等しいのです。ユーザーには、コンターファイルを作成するためにたくさんのモードが用意されています。
最初の選択は、2D、または、3Dコンターです。その意図がHYPACKと共にコンターを使うことにあるのならば、2Dコンターを選択してください。 AutoCad及びMicrostationのユーザーは、ターゲットファイルの次元によって選択を行うでしょう。いずれにせよ、その決定が3Dコンター と共になされた場合には、高さ/深さモードTINデータに及びターゲットデータに関して特別の注意を払う必要があります。
次の選択は、塗りつぶしコンターです。この特性を利用したい場合には、あなたには2つの選択があります。Acad Fillスタイルは、AutoCad、及び、Microstationユーザーのために設計されています。それは、比較的大きいファイルを生成します。しかし、最終結果は、より良いものとなります。Hyplot Fillスタイルは、主として以前のHYPACKユーザーために設計されています。出力されるDXFファイルは、はるかに小さいものになります。
スムーズコンターは、2Dエクスポートのみで有効となります。Acad スムーズオプション(主としてAutoCad、Microstationユーザーのために設計されている)は、8つのセグメントによって全ての円弧に近似 するB‐スプラインを生成します。ベジェオプションはベジェスプラインを生成します。それは、HPGL/2の互換性があるプロッタを持たないHyplot ユーザーのために設計されています。あなたのプロッタがHPGL/2互換であるならば、あなたは、Hypoltを使うことを勧めます。また、TINプログ ラムにおいてはNo Smoothを選択し、HyplotプログラムではSmoothを選択するように勧めます。それは、比較的小さいファイルを生成し、プロッタにスムージン グ出力を可能にさせます。
最小のLegは、コンターファイルの平滑化効果を向上させるために、非常に有益な機能です。選択された数が0 TINと異なるならば、プログラムは、指定された数より少ない長さの全てのセグメントを破棄することはありません。その効果は、下記の図において明白で す。それは、スプラインに対応する4、及び、2セグメントの多角線を示します。これらの2つの多角線は、形状は類似しているが、非常に異なるスプライン近 似を持っています。例は、その短いセグメントの除去が、鋭いコーナー上で平滑化を向上させ得ることを示しています。
Contour Stepは、あらゆる値の設定が可能です。エディットボックス( 10.0 )下のラジオボタンを選択することで0.01より大きい値を設定することも可能です。コンターステップは定義されたステップ( 0.1、0.5、1、2、5 )とあらゆる連続値の入力( Other/Levels )が可能です。
QTINモデルプログラムのAutoCADカラー出力機能(Exporting AutoCAD Colors From TIN Program)
FAQ ID:Q14-8
TINプログラムは作成したDXFファイルをAutoCADにも適応したカラーパレットで変換することができます。
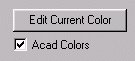
TIN カラーダイアログを開いてください。"Edit Current Color"ボタンをクリックすることで現れます。"Edit Current Color"ボタンをクリックすることでAutoCADで使用しているカラーパレットを使用することが可能となります。
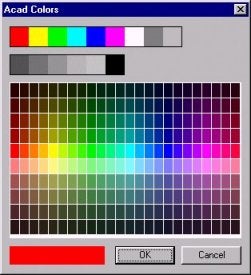
Acad Colorsにチェックが入っていないと、従来のカラーダイアログが現れます。チェックが入っているとこれに"Smooth","Inverse"ボタンが追加されます。
もしSmooth(色の平滑化)したければ以下の手順を踏んでください。
- Smoothをかける最後の色をクリックしてください。
- Smoothをかける最初の色をクリックしてください。
- それぞれの色をパレットから指定してださい。
- Smoothボタンをクリックすると1と2の間の色を平滑化します。
Inverseボタンは色を逆転させます。
以下にAutoCAD上とTIN ウインドウでのDXFファイルを示します。
File:dam7000b.xyz
DXF Export:2d contour,ACAD fill
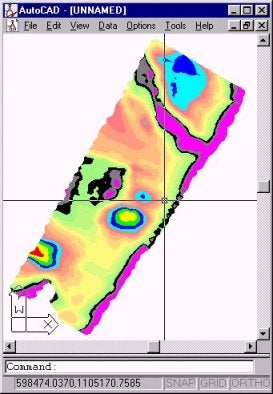
DXF file created by the TIN Model program loaded in AutoCad
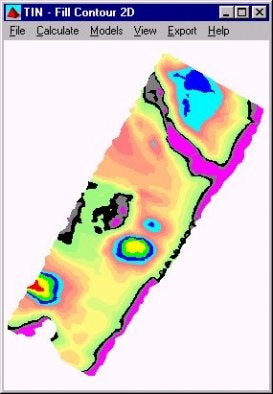
2D contour TIN in the TIN Model Program
QTINモデルを分割して生成する(Break Lines in the TIN Model Program)
FAQ ID:Q14-9
TINモデルプログラムを使って土量計算をする場合、サーベイエリア内で無視したい部分を省くことができます。これはクリッピングされたXYZファイルとTIN MaxSideを短くしてあるファイルで実行できます。
Break lineはどちらかの方法で簡単に使用できます。Break lineはTINの辺と交差しないようなラインやエリアで定義されます。これはラインエディタで作成することができ、Initial Dataダイアログ内のBreak linesにファイルネームを入力することによりTINモデル内に取り込まれます。TINモデルではこれらのラインに交差するTINは作成されません。よってこのエリアを土量計算で除くことができます。
- ラインエディタにおいて、TINを作成したくないライン、エリア、あるいはその両方を定義するラインを作成します。
- もしラインが閉じていなければ、TINモデルにてそのラインと交差するような三角形は除かれます。
- もしラインが閉じているならば(ラインエディタ内で始点と終点の位置が同じ)、ポリゴン内部にTINは作成されません。
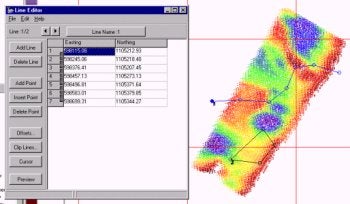
Creating the Break Lines
- FINAL PRODUCTS-TIN MODELを選択し、TINモデルを起動します。
- 初期値を入力します。以下の値を入力してください。
- Input File(入力するファイル)
- Line File under Break Lines(Break lineの下のラインファイル)
- TIN Max Side(三角形を構成する最少結線間隔)
- Calculation Mode(計算モード)
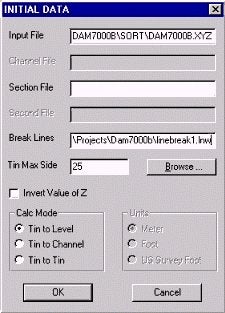
Creating a TIN Model with Break Lines
- OKをクリックすると、break linesで定義したライン・エリアを省いたTINモデルが作成されます。
TIN Model with Break Lines
これらのエリアを除いたTINモデルを使うと、どんな量でも計算できます。
QTINモデルプログラムにおけるシングルビームデータの処理方法の改善(TIN Model and Single Beam Data)[英語]
FAQ ID:Q14-10
There are many obstacles to create a useful TIN from a single beam data set. Although the data set might have a high level of accuracy the corresponding TIN can be almost unusable.
The main problem is to prevent the creation of undesirable triangles along the edges and wide triangles inside of TIN body. These triangles contribute to volume calculation error and contour accuracy.
To prevent such situations, we use the original planned line file that guided the vessel as the data was collected. The line file will prevent the TIN generator from connecting any three points that belong to the same line.
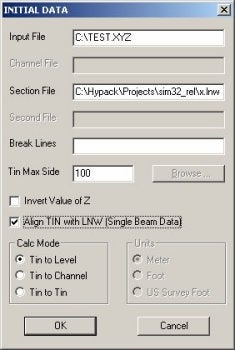
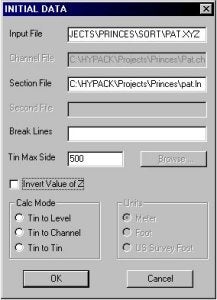
The Initial Data dialog has an additional check box that allows you to align the TIN and the corresponding line file. The line file name should be entered in the "Section File" field. Set the TIN Max Side as usual and click OK to create your model.
There are a few requirements regarding the planned line file:
- It can not contain intersecting lines.
- It can not contain a line without corresponding data.
- It must keep the lines in consecutive order.
Failure to meet any of the requirements will result in a badly created TIN that will lead to incorrect volume calculations and very strange contours.
An attempt to TIN multibeam data with the method will produce the same effect. The following pictures show the standard and the new methods applied to a real data set.
Looking at the first pair of pictures, you will see that we have achieved both goals:
- Eliminate wild triangles along the edges.
- Eliminate wide triangles inside the TIN body.
The second pair shows the contours. You can see that the new method eliminates all disruption along the edges or survey lines caused by poor triangle formation
The next set of pictures is an artificial example. Our first picture shows an imaginary channel 200m wide, 50m deep with 1:1 slope on both ends.
Four survey lines cross the channel at an angle of less than 45 degrees. The following pair of pictures are Solid TIN models with contours. You can see that the standard method creates bumps along the channel edge making a nonexistant volume buildup that affects the volume calculation. The new method calculates the volume (below 0.0 level) correctly 1 125 000.00 volume units. An error of about 1.3%.
QXYZファイルからマトリックス(MTX)ファイルを作成する(XYZ to MTX Program)[英語]
FAQ ID:Q14-11
In our last newsletter, Lazar described a feature new to the TIN Model Program that converts the input XYZ data and outputs a filled, HYPACK® type Matrix file. The reaction from our users was so enthusiastic, we decided to make this feature a stand-alone utility. Here's how it works:
- Select PREPARATION-XYZ TO MTX and the dialog will appear.
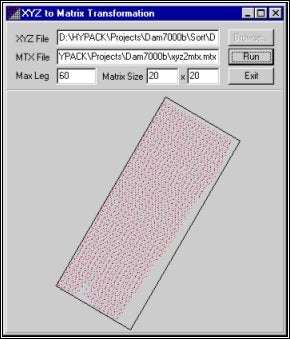
XYZ to MTX Transformation dialog
- Fill in all of the fields.
- Enter the XYZ file you wish to convert. ([Browse] makes it a snap!)
- Enter the path and name for your new Matrix file.
- Max Leg specifies the maximum distance used to connect to XYZ data points. This value must be greater than 0. Start with about 150% of your line spacing. You should set this large enough so your data points connect, but not so large that points which have little relationship connect to each other. The value of this field depends on the density of the input data. If the value is too small, the final result will be incomplete. If the value is too large, the creation will be slow.
- Matrix Size fields really define the cell size within the Matrix to be created.
- Click [Run]. The program generates a surface model and then calculates the Matrix size and rotation to fit the data. It then fills the matrix cells with the depth nearest the center of each cell calculated from the surface model.
A small representation of the results is drawn to the lower part of the dialog. You may also view the results by loading the Matrix file to the HYPACK® MAX screen.
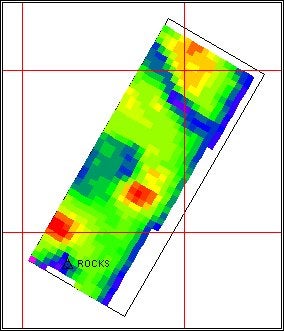
The resulting Matrix displayed in the main window
Q新しいXYZ出力ユーティリティー(Changes in XYZ Export in TIN MODEL)[英語]
FAQ ID:Q14-12
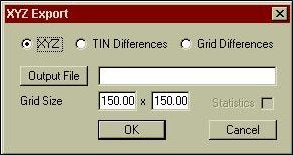
While I was down in Florida demonstrating the TIN MODEL to a client, I was surprised to see that the XYZ Export options in TIN MODEL had been expanded. Instead of being included in the Matrix Export window, the XYZ Export now has its own window, shown in the figure to the right.
It was a little confusing at first, but I quickly figured out the available options.
XYZ:
This is similar to the old XYZ Export option of the TIN MODEL. It is used to output a gridded ASCII XYZ file at user defined spacing. The user can enter the X and Y spacing (150 x 150 in our example above). The TIN MODEL program then takes the current surface model and determines the Z-value of the model at the grid’s nodes. It exports these values to the user-supplied name.
TIN Differences:
This was also available in the old TIN MODEL version. It is used to generate a model that represents the difference in z-level between two input models. A good example of its use would be in a beach erosion study, where you have two surveys done at different times of the year.
This routine takes the primary model (shown in red) and computes the level above (positive) or below (negative) a secondary model (shown in black). Each computed difference is then saved as the z-value for the x-y pair. The result is an ASCII XYZ Difference file that can then be read back into the TIN MODEL to show where material has accumulated or depleted. By calculating the volume of the differences above/below the 0 level, you can determine if you have had a net gain/loss of material during the study.
Grid Differences:
This is a new routine for the TIN MODEL. It is similar to the TIN Difference method, but instead of outputting the z-differences at the nodes of a model, it outputs the z-difference between two models at the user-specified spacing.
In the example shown to the right, the program would compute the z-difference (primary z-value minus secondary z-value) at a regular spacing, as defined in the XYZ Export window.
The resulting file can also be read back into the TIN MODEL to compute the net gain/loss of material between the two surveys.
All of these output files are in ASCII XYZ format and can be imported back into HYPACK® MAX or most other applications.
Q最新のDXF出力機能について[英語]
FAQ ID:Q14-13
The TIN Model program has a new routine for exporting DXF files. While maintaining most of the features of the previous routine, it has a few new features and has become a bit easier to use. You can:
Create labeled contour lines in 1-step instead of creating the lines and labels separately.
Customize contour colors more easily than before. This color scheme is separate from HYPACK® or TIN Model color schemes.
Add weight or texture to a lines to help distinguish them from neighboring contours.
Let’s take a look at how it works and look at these improvements as we go. (We can work from the Sample_Monepts project file, if you have the 2003 HYPACK® Training Conference CD.)
Launch the TIN MODEL program and create a simple TIN to Level model.
Original TIN Model
Access the DXF EXPORT routine in the same way as before, by selecting EXPORT-DXF FORMAT from the TIN MODEL menu.
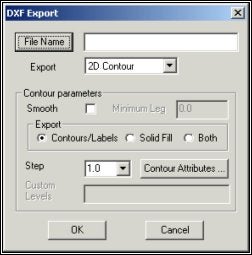
Set your options for the DXF file to be created.
The new DXF Export dialog includes most of the features previously available though you may see them in a slightly different form.
Name the DXF file to be created as you did before. Just click [File Name] and enter the path and name.
The Export Mode is selected from a drop-down list, just a minor change from the former radio buttons.
Note: 3D files only appear in three dimensions when you load them to a CAD program. In HYPACK® MAX, they are viewed from above and appear only 2-dimensional.
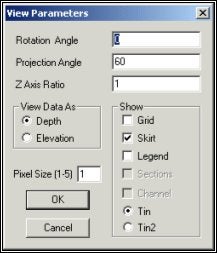
In the previous version of DXF Export, Export Object was selected in this dialog. This selection is now made in the view options dialog.
Most often, you would select TIN. The TIN2 option might be used if you have done a TIN to TIN calculation. In this case, TIN will draw from data in the Input File and TIN2 will draw from the data in the Second File as specified in the Initial Data dialog of the TIN MODEL program.
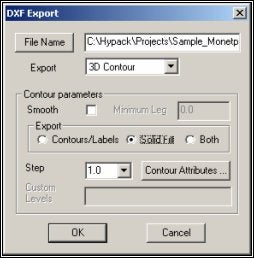
The Contour Parameters area is where the most significant changes have been made.
Smooth enables you to create smoothed contours. It creates a DXF file about ten times the size of the non-smoothed contours. These smoothed contour s can not be plotted from the (older) HYPLOT program. They can be plotted from HYPLOT MAX or from other CAD packages so, if you want to plot smooth contours, you will need a printer that is up-to-date enough to handle it. (Basically, that’s anything other than an old pen plotter.)
The Minimal Leg limits the amount of smoothing. Smoothing will not occur where the TIN Model leg is shorter than specified here. (This option hasn’t changed!)
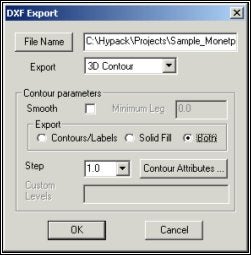
Export defines exactly how much data should be included.
Contours/Labels creates contour lines and, if specified in the contour attributes, labels for them.
Solid Fill creates color-filled contours.
Both overlays contour lines on color-filled contours.
Step enables you to specify a regular contour interval, used in the creation of 2D and 3D Contours. If you desire an irregular step, click on [Other] then enter your desired contour levels in the Custom Levels field. Leave a single space between each contour level. For example, “2 5 25 100". (This option has only been changed to a drop-down box from radio buttons.)
Once you have the contour parameters set, click [Color Attributes]. The Line and Label Attributes dialog will appear. Each contour level is shown at the left according to the depth range of your data and the Step specified in the previous dialog.
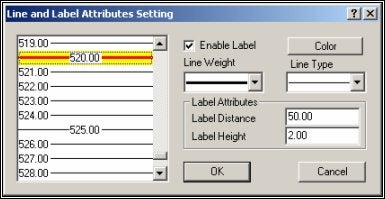
Line and Label Attributes Dialog
You can select one or more of them then, quickly and easily, make selections at the right to set their attributes. The display on the left shows how each contour line will appear in the exported file.
To select several individual contour lines, hold the Ctrl key while you use your mouse to choose your lines
To select a range of contour lines, hold the Shift key and select the first and last line of a range.
Enable Label places labels on the selected contour according to the Label Attributes where:
Label Distance defines the distance, in survey units, between the labels on each contour.
Label Height sets how big the label will be.
Line Weight offers a choice of increasing thicknesses for you to accentuate certain contours.
Line Type provides five options, solid line and four combinations of dots and dashes for further distinction from other lines.
Note: Windows® can not handle both line type and weight. Therefore, in any Windows® application, including HYPACK® MAX, contours that have been given both a dotted line type and a weight thicker than 1 pixel, will appear solid. They will, however, be drawn with both type and weight characteristics if you import them into a CAD package.
In this example, we have created contours every foot (or meter depending on your survey units) and every 10th contour is accented with a weighted red contour line. Also, every 5th contour is labeled at 50 foot (or meter) intervals along its length with numbers 2 feet (meters) tall.
When you have finished specifying contour attributes, click [OK] to return to the DXF Export dialog.
Click [OK] again to create the DXF file. You will see the file drawn to the TIN screen.
It will be saved to the specified place and File Name ready to be loaded to HYPACK® MAX as a background file or to any other package that uses DXF format files.
Resulting DXF File drawn to HYPACK® MAX screen
In this example we created 2-dimensional,
labeled contour lines.
With one or two simple changes in the DXF Export dialog,
we can make it 3-dimensional file or
a solid fill contour.
Close up View of Resulting DXF in HYPACK® MAX
Change the Export Contour Parameter to “Solid Fill” and the lines and labels are replaced by a color-coded solid image.
Solid Filled Contours
Change the Export Contour Parameter to “Both” and the labeled contour lines are superimposed on the solid fill model.
Smoothed, Solid-filled, Labeled Contours