HYPACKに関する質問
11.ユーティリティ(Utilities)に関するFAQ
Qデータのマージ(結合)(XYZMERGE - Merging topographic data with HYPACK® data)
FAQ ID:Q11-1
多くのユーザより、1つに融合された測深データと陸測データを含んでいる断面を描く事を可能にするために、陸測データとHYPACK(TM)データとを融合するための方法を改善するように依頼がありました。これは海岸沿いの測量では重要な事です。
USACE-フィラデルフィアのJoe Scolariのために行った仕事の一部として、私達は現在XYZマージプログラムをリリースしています。このプログラムはHYPACK(TM)MAXに 組み込む予定です。また、HYPACK(TM)メンテナンスプランに加入しているユーザには、要求があればe-mailにてお送りできます。
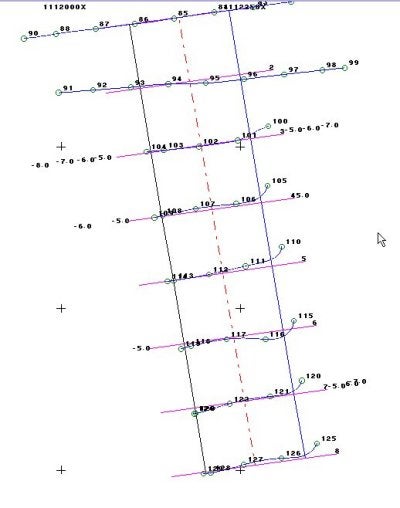
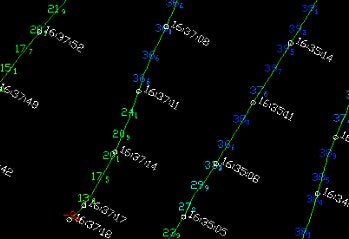
上への図は、陸測データのASCII XYZファイルとともにDESIGN画面に描かれた編集済みのHYPACK(TM)データの航跡が表示されています。ここでの、HYPACK(TM)データはすでにSINGLE BEAM EDITORプログラムにより編集済みのデータですので、これはHYPACK(TM)ALLフォーマットです。
水路の側の黒い数として示されている陸測データは、ASCII XYZデータファイルです。プログラムは、各々のデータラインに他のデータが全くなく、各々のX-Y-ZデータラインがCR-LFによって終わっていれば、スペース区切り、コンマ区切り、または固定されているデータフォーマットのデータを読むことができるはずです。
プログラムを実行します。初めに、上部のブラウズボタンをクリックし、編集済みのHYPACK(TM)LOGファイルの名前を選んでください。次に、下のブラウズボタンをクリックし、ASCII XYZフォーマットで書かれた陸測データのファイルの名前を選んでください。
続いて、新しいデータ用の3文字の拡張子を入力してください。XYZマージプログラムは、既存のHYPACK(TM)データファイルと同じルート名を使って新しいデータファイルを作成しますが、融合されたデータはここで決めた拡張を使いに保存されます。
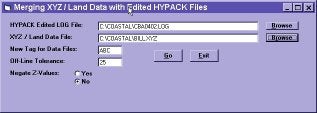
ここで"Off-Line Tolerance"距離(許容距離)を入力してください。XYZマージプログラムは、測線からこの距離以内のどのようなポイントでも新しいデータファイ ルとして割り当てます。陸測データがデータファイルの最初または最後に正しく割り当てられるので連続したデータに再び戻ります。
ユーザは、Z値を反転することも出来ます。例えば陸測データ「5.52」が海図基準面より上方であった場合、"negate Z-value"がYESに設定されていると、それは「-5.52」として保存されます。測深データが下方が正の方向であり、一方では、陸測データが上方が正の方向の時は、この機能が必要です。
設定が終わったら、"Go" ボタンをクリックしてください。1つのファイルあたり数秒で作業が済みます。
QDXFファイルから測線ファイルの作成(DXF2LNW)
FAQ ID:Q11-2
HYPACKユーザーにとって有用なユーティリティがあります。大抵は、Channel Designプログラムは、チャンネルで測線ファイルを区切る機能だけで十分ですが、時に、いびつなチャンネルのために、思うように測線ファイルができな い場合があります。例えば、急なカーブやエレベーションがあるチャンネルです。Channel Designは、エレベーションを扱うように意図されてはいないので、ここでエレベーションという言葉を使うのは正確ではありません。AutoCADに熟 練していて、AutoCADでチャンネルリミットを作成したり、計画側線を作成したりしたい場合に、便利なツールを用意しました。DXF2LNWという名 前のプログラムで、HYPACKのメンテナンスプランの契約をしているユーザー全ての人が使うことができます。
このプログラムは、私がクロアチアへトレーニングのために出張した際に、最近テストされたものです。Predrag Vukadin of Brodarski Instituteが、クロアチアの水路保守機関であるHrvatske Vode向けにテストのためのシステムを組み上げました。このシステムではRTK GPSと、測深器を一つ、そしてHYPACKR ソフトウェアが使用されています。一見、比較的簡単なように思われますが、エレベーションを扱っていることと、傾斜した河川の測量では、中央の深度が一定ではないことに気づきました。Channel Designはエレベーションや変化する中央の深度を扱うには向きません。各々のクロスセクションに対して、別々にテンプレートを作成することは、手間がかかり過ぎます。そこで、DXF2LNWプログラムの出番が来たわけです。
彼らはマッピングとデザインをAutoCADを用いて行うので、dxfファイルに計画測線とチャンネルリミット情報が入っていると便利だと我々は思いました。Coastal社のプログラマーであるBill Bergmannと、何度も電話やE-mailのやりとりをした結果、彼は我々のジレンマを解消してくれるプログラムを送ってくれました。
このユーティリティを使用してdxfファイルをAutoCADで作業できるようにする前に、少々の準備が要ります。斜面の中央線、左端、右端、そして上端 は、すべて3Dポリラインでなくては鳴りません。また、それらは皆、同方向でなくてはなりません。(エレベーションを扱う場合には、z値をマイナス値とし て入力しないと、逆さまなテンプレートになってしまいます。)これら5つのポリラインは、それぞれ一つのレイヤー上に配置しなくてはなりません。計画側線 は全て、もう一つのレイヤーに配置しなくてはなりません。
このユーティリティの使用法はいたって簡単です。プログラムへdxfファイルを読み込み、レイヤーを選択し、「export」ボタンを押すだけです。プロ グラムは、計画測線がチャンネルリミットに架かっている場所を探し、テンプレート情報としてlnwファイルへ書き込みます。
つまり、変則的なチャンネルやエレベーションでデータ処理をする場合や、CADでデザインや計画測線作成を行いたいときに、DXF2LNWが役に立ちま す。メンテナンスプランの契約をしていて、このプログラムを使用したいのであれば、東陽テクニカ 営業3部へ連絡ください。
QHypackMaxでのカスタム出力機能(Custom Output with HYPACK® MAX)
FAQ ID:Q11-3
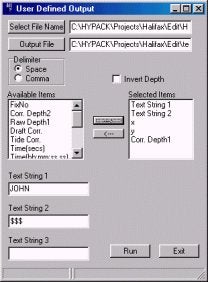
User-Defined Outputプログラムを使用すると、編集済みファイルや各種情報ファイルを任意のフォーマットで出力できます。
実行には出力したい編集済みログファイルやデータファイルを選択し、出力ファイル名をつけます。そしてAvailable itemsのリストから出力したい項目を選択します。出力項目には任意の文字列を3つまで登録することができます。出力されるファイルはSelected Itemsに登録された順に並べられます。それぞれの項目をスペース区切りにするか、カンマ区切りにするかの設定も可能です。
User Defined Output Program
Output file created from User Defined Output Program
Q航跡から測線ファイルを作成(PATHFINDER)
FAQ ID:Q11-4
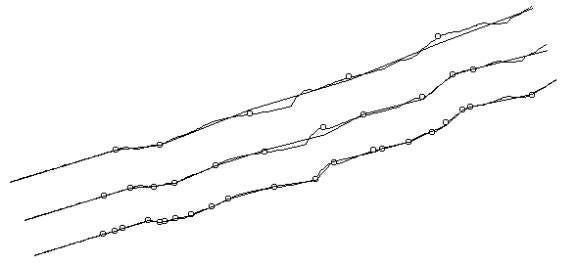
Pathfinderは、Hypack(r)に追加された新しいツールです。シングルビームの水深データを使って最適な測量ラインを計算するためのものです。メニューは、至ってシンプルです。Setup, Run ,Exitというたった3つの項目が有るだけです。
Setup オプションをクリックすると、幾つかの初期データを要求するダイアログボックスが表示されます。
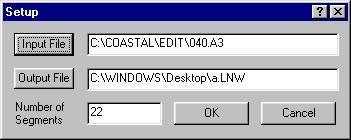
プログラムは、ログ, All そしてXYZフォーマットのファイルを入力ファイルとして利用できます。 セグメントの数が要求され、最適な近似を行なうためのセグメント数を決定します。結果はユーザーが指定したLNWファイルに保存されます。もし入力データ が幾つかの測線を含むログファイルであった場合、各ログエントリー毎に処理されます。
Qチャンネルコンディション(水路状況)プログラムのアップデート(Channel Condition Update)
FAQ ID:Q11-5
(click to see a larger image)
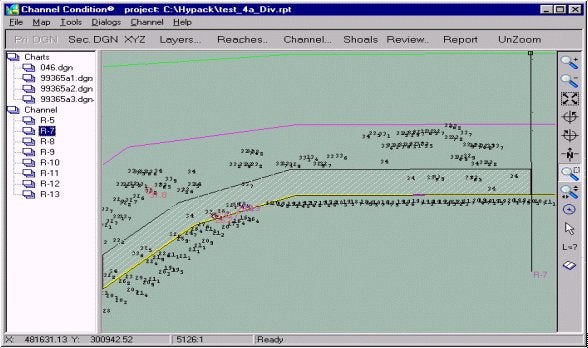
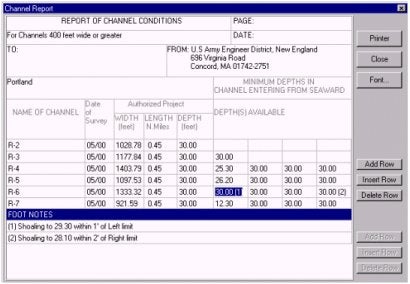
船舶が安全に航行できるよう浅瀬に関する情報を提供することがアメリカ合衆国では連邦命令となっています。しかし、供給する水深データは水路深度と水路幅のトレードオフとなります。
一般的には、測深データで最浅値を選んでいれば常に安全ですが、より大きな深度を要する船の場合には必ずしも安全だとは限りません。
最浅値、特に浅い場所が安全に避けられる部分に集中している場合は、必ずしも綿密な管理水深は必要ないと思われます。水路の境界や端近くで、水深値が浅くなるという理由から、ユーザはソフトウェアで「shoaling inspection zone」として設定します。reach editor window内で水路端の左右の外側から、要求されるゾーン幅が配置されます。ゾーン内で最も浅い深度はレポート内でfootnoteとして報告されます。一方ゾーンの外側で最も浅い深度については水路管理として報告されます。
Film at 11:00
Qチャンネルコンディション(水路状況)プログラムの使用(Using the Channel Condition Program)[英語]
FAQ ID:Q11-7
At the time of the HYPACK® Max release, the Channel Conditions Program was still in the developmental stages. Since then, the program has been completed and is going into beta testing so I thought I'd provide you with an update.
The changes from the original program have to do with the channel and reach properties.
Setting your Channel Properties:
Enter the Channel Properties by selecting CHANNEL-PROPERTIES or clicking [CHANNEL]. The Channel Properties dialog will appear.
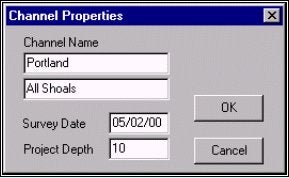
The Channel Name can be any name you choose with 2 lines available.
The Survey Date represents the day(s) when you conducted the survey upon which the report is based.
The Project Depth is assigned to the entire channel. You can "over-ride" this value for an individual reach by right clicking on the reach divider handle on the map and selecting PROPERTIES. A dialog will be displayed in which you may edit the settings for that reach.
The choices regarding the report have been removed. Working with the U.S. Army Corps of Engineers, we have developed a simpler option controlled through the reach properties.
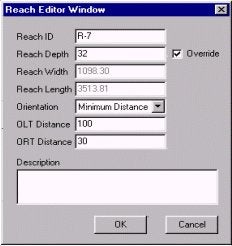
Setting your Reach Properties:
Right click on its handle and select PROPERTIES. The Reach Editor will appear.
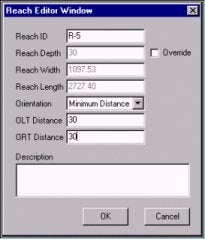
Reach ID specifies which divider is described. You can change the name if you wish.
Reach Depth displays the channel depth from that divider to the next. Check Override to enable a change in the depth for that segment only and type in the new depth.
Reach Width and Length are displayed, but may not be edited.
Orientation offers 3 choices:
-
Minimum Distance positions the divider at the angle where it crosses the shortest distance between the outside left and right lines of the channel.
-
Perpendicular positions the divider perpendicular to the outside lines.
-
Set Angle enables you to set the angle at which the divider crosses the channel.
OLT (Outer Left) and ORT (Outer Right) Distances may be specified for each reach. This option creates longitudinal lines at the specified distances, parallel to the left and right toe lines respectively. If these are created, the report generated will exclude the data in these zones from the available depths for the channel. The shoalest depth in these zones, if less than project depth, will be footnoted. Excluding the distance along the shore acknowledges and defines sloping banks, and focuses the report on the center, navigable area.
The newest feature of the Channel Conditions Program involves the Outer Left and Right Distances.
If these values are left at "0", the report will be created as it was before, presenting the controlling depths in each reach (and for each segment if you chose a segmented Channel Type).
If these values are greater than "0", the shoreline zones will be drawn. They are displayed on your screen as a gray, shaded area.
The report generated will then include only the unshaded, center area, footnoting the controlling depths of the shoreline zone(s).
Q潮位補正(Tide Adjust)
FAQ ID:Q11-8
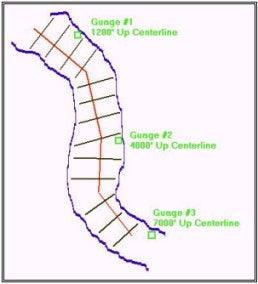
このプログラムは、河岸(もしくは海岸)に複数の潮位計が設置されてある測量の為に作成されました。TIDE ADJUSTMENTSによって、潮位補正値を潮位計間の距離に基づき補間します。このプログラムによって、Rawフォーマット形式でも、編集済みのAllフォーマット形式でも、潮位補正を適用することが可能です。必要なものは、
- 各々の潮位計についての*.TIDファイル
- センターラインに沿った各々の潮位計からの距離
- 潮位補正を行いたいセンターラインの*.LNWファイル
A River with 3 Tide Gauges and a Centerline Line File.
1. *.DIGファイルの作成
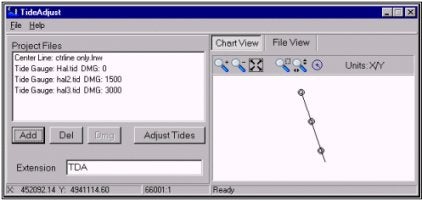
プログラムの開始PROCESSING-TIDES-TIDE ADJUSTMENTSを選択します。TideAdjustダイアログが現れます。中心線を記述した(もしくは何もない)*.LNWファイル名を入力 [ADD]をクリックして、中心線を選択します。 *.TIDファイル名を入力 そして、中心線に沿ったそれらの距離を入力します。
[ADD]をクリックして潮位ファイルを、ファイルマネージャから選びます。
注:一つ一つを別々に追加することもできますが、Ctrlキーを押しながら、必要なファイルをクリックすることで、一括して選択する事ができます。
「DMG」をクリックして、GEODESYで定義された距離単位での距離を入力することで、「Tide file」で選択された各々の潮位ファイル間が補間されます。
補正するデータファイルを選択「ADD」をクリックして、「Add Log Files」または「Add Raw/All files」を選択します。そして、ファイルマネージャーからファイルを選択します。
必要に応じて、拡張子を選択 既定の拡張子はTDAです。
The Tide Adjust Dialog
音速の補正 「ADJUST TIDES」をクリックします。これにより、指定された拡張子でファイルが作成されます。既存のファイルを上書きしてしまうことはありません。
Q測深値の補正(Sounding Adjustments Program)
FAQ ID:Q11-9
SOUNDING ADJUSTMENTSプログラムは編集済みのAll Format形式のログファイルに対して音速補正を施すアプリケーションです。補正処理終了後の結果は、single bean editorのSV correction columnを参照する事で確認出来ます。
- PROCESSINGメニューからSOUND VEROCITY-SOUNDING ADJUSTMENTSをクリックして、音速補正プログラムを起動すると、水深、音速入力テーブルが表れます。
- テーブルの各項にデータを入力してください。水深値の単位はgeodetic distans unitsで指定した単位と同じです。Correctionの単位はm/secです。
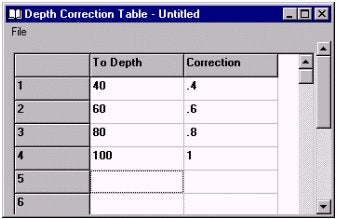
Depth Corrections Table - 作成したテーブルの保存は、FILEメニューからSAVE又は、SAVE ASで名前を指定して行ってください。
- FILEメニューからGENERATEを選択し、ログファイルに対して補正を行います。SINGLE BEAM EDITORにより補正の結果を確認することが出来ます。このサンプルシートでは、水深40m以下は0.4、40mから60mの間では0.6が採用されます。
Qデジタイザで取込んだデータの使用(Shore Manual)
FAQ ID:Q11-10
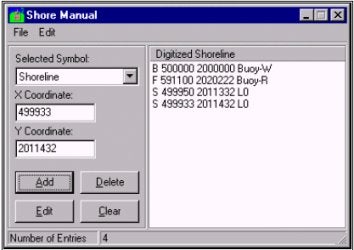
ショアマニュアルプログラム(SHORE MANUAL program)は、海岸線および海図記号を、Digitized Shoreline Format(*.DIG)へ手入力にて作成するために使用されます。これらのファイルはEDITINGとSURVEYプログラムにおいて表示されて、HYPLOTプログラムのスムーズシートにおいてプロットする事が可能です。
Shore Manual Dialog
1..DIG Fileの作成法
- Selected Symbol項目のドロップダウンボックスからオブジェクト(Shoreline, Rock, Wreck, Buoy, 他)のタイプを選んでください。
- 選択したオブジェクトのX-Y座標を入力します。
- [ADD]ボタンをクリックします。選択した項目は、ウインドウの右側にあるリストに表示されます。
- 表示したいポイント数分ステップ1-3を繰り返します。
- FILE-SAVEまたはFILE SAVE ASをクリックし、ファイルを保存してください。デフォルトであなたのプロジェクトディレクトリに保存されますが、SAVE ASを使用すると、他の場所に保存することができます。
2. リストの編集
- 入力済みの変更したいポイントを選択します。そのポイントの情報は左側に表示されます。
- ポイントの情報を入力します。
- [EDIT]ボタンをクリックします。新しいデータが元のデータに置き換わります。
注意:もし最初から入力し直したいのであれば、[CLEAR]ボタンをクリックします。そうすると右のリストは全て消去されます。 - ファイルを保存します。FILE-SAVEをクリックし、.DIG拡張子を使用してファイルに名前を付けてください。ファイルはプロジェクトファイルに保存されます。
Q特定のエリアのXYZファイルを作成する(Clipping XYZ Survey Files to a Border File)
FAQ ID:Q11-11
Clipping Survey Files
Borderファイルで規定された範囲に合わせて、ソートされたXYZファイルを抽出することができます。
- [Preparation-Editors-BorderEditor]を選択し、BORDER EDITORプログラムを起動します。
- [File-New]を選択し、新規ファイルの作成を設定します。
リストに多角形の頂点座標を加えるために、[Edit-Add point]をクリックします。
境界線が全て入力されるまでこの過程を繰り返します。このポイントにより、1つの連続したラインを形成し、最後の点は、このエリア内部の任意の点を入力します。
- [PREVIEW]をクリックすることにより、入力したイメージを確認できます。ポイントはスクリーンに表示されます(参照:プレビュー画面)。変更の必要がある場合は、BORDER EDITORを再び開き編集をする事ができます(参照:プレビュー画面)。編集する座標を選択し、[Edit-Edit point]をクリックし正しい座標値を入力します。

(図.プレビュー画面) - 入力後、[File-save]をクリックして、ボーダーファイル(*.brd)を保存します。
- Data File のSorted Data Files内のXYZデータを右クリックし[Clip to Border File]を選択します(参照:XYZデータの選択画面)。選択に使用するボーダーファイルの選択画面よりファイルを選択します。次に、選択されたXYZデータの名前を付ける画面が出るので名前を付け保存します。
(図.XYZデータの選択画面)
QADCPを利用する(ADCP Programs in Hypack Max)[英語]
FAQ ID:Q11-12M
ASB Systems, Coastal O's affiliate in Mumbai, India, has been hard at work on the development of our new ADCP data collection and processing modules, which will be included in the next release of HYPACK® Max. These modules have been designed to log data from RD Instruments' Workhorse ADCP's.
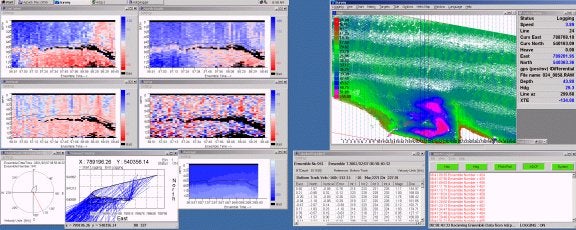
Figure 1: Hypack®’s ADCP Logger and Survey programs
The first module developed is the ADCP Logger. This module is designed to run alongside the HYPACK® Survey program, logging ADCP data simultaneously with HYPACK® raw data. The program uses RDI's ADCP configuration files to deploy the ADCP. The Logger has numerous display windows, including velocity profiles, intensity profiles, current magnitude, and tabular displays. The logged data files contain RDI raw data from the ADCP, in addition to navigation data passed from the Survey program through Shared Memory and into the Logger. The user also has the option to log standard RDI *r.000 files.
The next module is the ADCP Profile program. This program allows the user to load HYPACK's edited files and ADCP files, and get a cross sectional view of the survey line, echosounder depth or ADCP bottom track, and also display the current velocities. The user can then print or plot these profiles, and also calculate discharges and print a report.
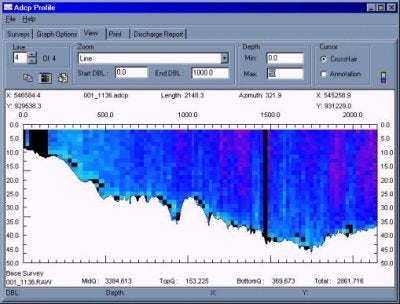
Figure 2: ADCP Profile program
Last but not least is the ADCP to DXF program. This program was created so that the user can create DXF current vectors from the data collected in Survey and the ADCP Logger. The user can specify vector length, vector type, current depth level and current speed units. These DXF vectors can then be imported into CAD/GIS packages, or plotted right in Hyplot®.
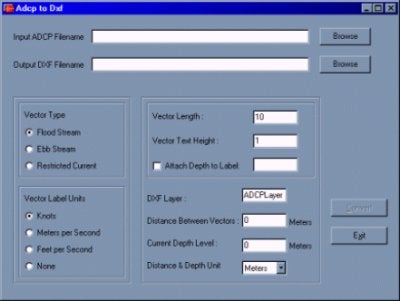
Figure 3: ADCP to DXF program
Q次期チャンネルデザイン(水路計画)プログラム(Advanced Channel Design 2001)[英語]
FAQ ID:Q11-13
New advanced channel design program is ready for beta testing. It will replace old 16bit version but we will retain old chn data format.
I want to emphasize several new features that are implemented.
Node Editing:
- Import nodes from lnw, xyz or chn file
- Enter nodes on mouse click
- Graphic control during editing process
Face Editing:
- Graphic control during editing process
- Add toes for selected edges
- Check face integrity (flatness, orientation, convexity)
Section Editing
- Graphic control during editing process
- Multisegment sections
3D viewer:
- Interactive rotation
- 3D shading
The picture below shows screen captures of two sample channel files.
QXYZ入力プログラム(XYZ Collector)
FAQ ID:Q11-14
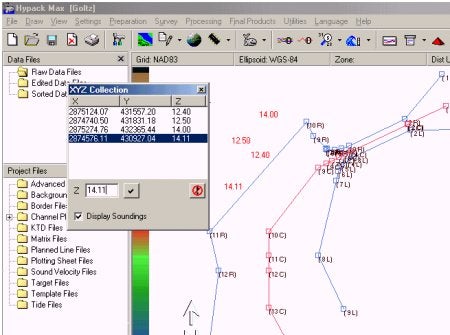
処理の途中でXYZファイルを作成する新たな機能が追加されました。新しいXYZ CollectorはHYPACKMAXのメインメニューまたは、ツールバーのショーカットから起動します。エディターが開いたら、座標値を入力したいポ イントをマップ画面上でダブルクリックします。エディター上にダブルクリックした位置の座標値が表示されたら、エディター下部のZ入力欄に水深を入力後 チェックマークのついたボタンをクリックします。
作成したXYZファイルは、現在のプロシェクト内の\Sort\sounding.xyzとして保存されます。このファイルはEditorを起動、終了するたびにアップロードされます。
簡単な例を以下図に示します。
QDXF/DGNファイル出力のオプション(Export to DXF/DGN Options)[英語]
FAQ ID:Q11-17
By now, almost everybody currently utilizing the Hypack® maintenance plan should have received the version 00.5B CD. This version has significant improvements over the successful 00.5A release. No sooner than the release of 00.5B had been sent out had there been a service pack sitting up on our website, containing updates to the 00.5B software. And by the time you read this, we should have Service Pack 2 posted up there as well.
There have been some significant changes to the programs lately, especially with the new Export program. This new Export program (Export (New) in the Final Products menu of Max) will eventually replace the old VB program (Export in the Final Products menu).
Some of the biggest changes were made to the export to DGN/DXF routines. The sounding parameters (see below) offer you plenty of export options.
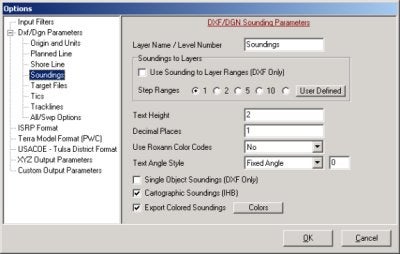
You can now export soundings to different layers and colors depending on ranges, export cartographic soundings, and even export single object soundings, whereas the old program created separate entities for the whole number, decimal point and decimal values. The color ranges are derived from the standard Hypack® Max color settings dialog box, like all the other color dependant programs.
Truncation and rounding rules are taken from Hypack® Max’s Control Panel. By selecting Truncate to Tenth (under the Soundings tab in the Control Panel), your DXF soundings will be lopped off to the tenth decimal place. By using the rounding rules, your soundings will be rounded to the user specified tenth, half or whole number.
Added to the trackline export is the option to label events with either the event number or the event time. DXF export also gives the option to export each trackline to it’s own layer.
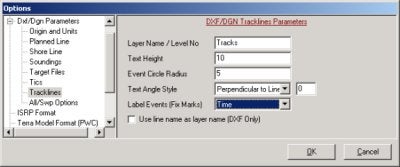
The example below shows the DXF file as displayed in AutoCAD. The soundings are truncated to the tenth decimal place, colored, cartographic style, and on different layers. The tracklines are exported with time labeled events, and each trackline is on it’s own layer.