HYPACKに関する質問
6.サーベイ(HYPACK® Max Survey)に関するFAQ
Qローカル座標使用時にSurvey画面に表示される船の向きをグリッドと合わせる
FAQ ID:Q6-1
下図のようにローカル・グリッドを回転(Rotation)させた場合、計画測線(LNW)やマトリクス(MTX)はこのローカル・グリッドの設定に基づいて作成されます。
しかし、方位センサからのデータは マグネティック方位を出力しているだけです。
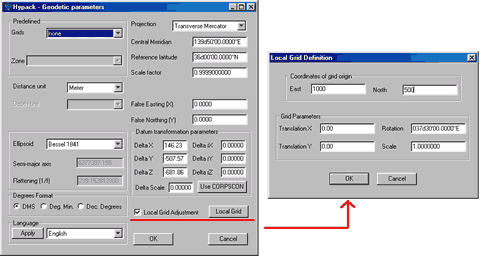
ローカル・グリッドを使用する時には、下図のように方位センサの"Yaw"オフセット(度単位)にもローカル・グリッドの回転角を設定して下さい。
QDesignプログラムで作成した測線(LNW)がSurveyプログラム上で現在の船の位置と異なった場所に表示される
FAQ ID:Q6-2
下記の点を確認してください。
測線(LNW)を作成する時のXY座標の入力は合っていますか?
HYPACKでは、南北が"Y"、東西が"X"の数学座標を使用しています。(下図参照)
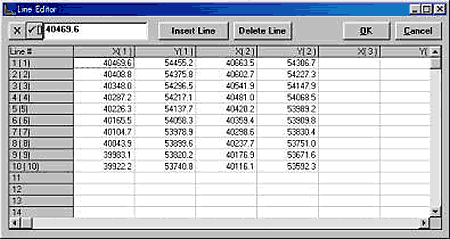
測線(LNW)を作成した時の測地の設定(Geodetic Parameter)とSurveyで使用している測地の設定は一致していますか?
Q千本電機社製PDR601測深機のデータが取り込めない
FAQ ID:Q6-3
PDR601で使用されるRS-232C測深データケーブルは、次のようになっています。
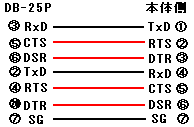
- Hardwareプログラムで定義している"Flowcontrol"を"None"から"Hardware"に変更してみて下さい。
(下図参照)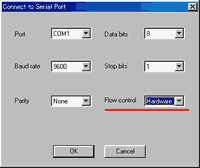
- PDR601のRS-232CケーブルDB-25P側で RTS,CTS,DSR,DTRのハンダ接続を外し、これらの外した信号線を次のように接続し直してみて下さい。RTS=CTS,DSR=DTR(この状 態で本体からは、常にデータが出力されるようになったはずです。)
- "PDR601.DLL"ではなく"Generic.DLL"を使用してみて下さい。
QSurveyプログラムのWindowメニューでTSSのデータを確認すると正しく来ているのに画面下に"Heave"と赤く表示されるのはなぜでしょう?
FAQ ID:q6-4

HYPACKを終了し、DMSView又はターミナルソフトを使用してTSSからのデータ見て下さい。
データ中に含まれているフラグが小文字になっていませんか?(下図参照)
これは、何らかの原因でセルフテスト実行中である事が考えられるので大文字の"U"になった後に測量(Survey)を開始して下さい。
023DE7-0007u 00230038
023DF6-0007u 00160041
053E1C-0007u 00090044
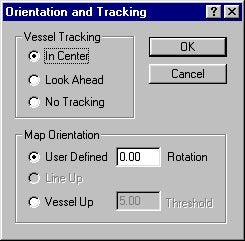
Qマップの表示方向
FAQ ID:Q6-5
マップの表示方向は、ユーザーによって定義することができます。画面上方を北にするには、North Upモードを使用します。画面上方を船の進行方向にするためにはVessel upモードで0に設定します。こうした機能を使用することでSurveyプログラムのMap<ウィンドウに表示されるMapを一定の方向に保つことができます。
デフォルト設定はVessel TrackingにIn Center、Map OrientationでUser Definedに0が設定されています。この設定はSurveyプログラムによって、“ini”ファイルに保存されます。
Q測量中の時刻、イベント、位置をデータファイルとして残す
FAQ ID:Q6-6
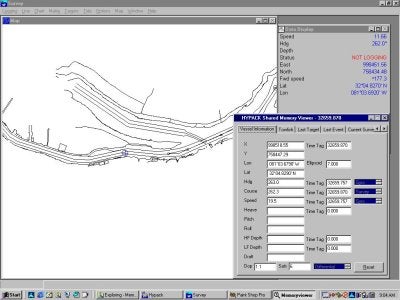
- 測量時の時刻、イベント、位置をデータファイルとして保存する為には、まず測量プログラムを起動します。
- メニューよりオプション>共有メモリ>出力を選択します。(図1参照)
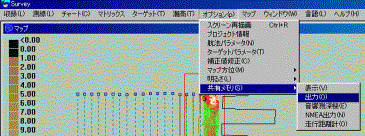
図1 - 図2のウインドウが表示されますので、左のリストより必要なデータを選択し[Add]ボタンを押して右のリストに入れます。
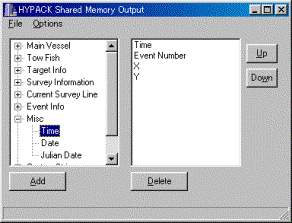
図2 - Options>CommunicationSetting…を選択し、データの書き込み先を決めます。
(手順:図3参照)1)Fileを選択
2)Update(単位ミリ秒)を設定
3)Filenameを[…]ボタンを押して出力先ファイル名を入力
4)[OK]ボタンを押す
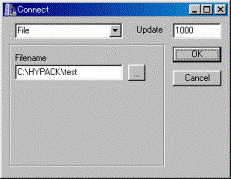
図3
- Options>Lockedを選択するとデータの書き込みが始まります。
- Options>Lockedを再度選択するとデータの収録が終了します。
Q測深不可能な浅瀬における処理方法(Water's Edge in the Survey Program)
FAQ ID:Q6-7
多くの水路測量士は、水深「0」を測ることまたは「岸線」位置を決定したいと思っています。HYPACKのバージョン8.9ではHYPACKのSURVEYプログラムでユーザが岸線をマークすることを可能にしています。
1. 測線の初めだけの岸線
図1では、調査船が、点1(堤防の頂点)から点3(川の中央)まで走りたい場合です。
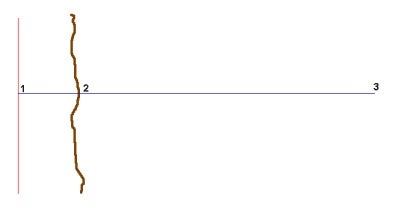
Figure 1 Marking the Water's Edge at the Start of Line
ユーザは海岸線へできる限り近くに船を操縦し、F6キー(岸線機能キー)を押します。
図2のターゲットパラメータメニューが表示されます。ターゲットの名前はデフォルトでは、注セクション"Notes section"とともに、"Water's Edge - "に測線の名前を付加された形式で表示されます。 特別な岸線ターゲットを示す為、デフォルトでは、深さ(Depth)は「0」、コード(Code)は「1」になります。ベアリング(bearing)はデフォルトで、現在の測線の逆向きになります。ユーザは現在の船から岸線への距離"Distance"を入力するだけです。ユーザがOKボタンを押した時に、プログラムは、岸線位置を計算し、情報をメモリーに蓄えます。これは、マニュアルイベントマークを使い測深機にもまたマークします。
収録の状態になるとすぐに、この情報はWTE(Water's Edge record)として生データファイルに蓄えられます。SINGLE BEAM EDITORプログラムはこれらの点を識別し、その点に「0.00」の値を割り当てます。
測線の端(点3)に到着すると、ユーザは収録を手動で終える(CNTL-E)か、またはスタートラインゲートを使用中ならば自動で収録が停止されます。
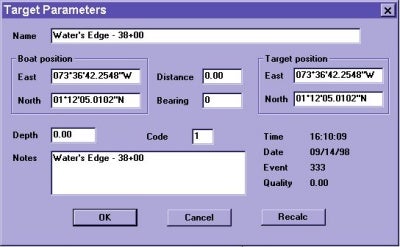
Figure 2 The Water's Edge Target Parameters window.
2. 測線の終わりだけの岸線
図3において、ユーザは、川の中央(点1)で測線を始めて、堤防の頂点(点3)に向かい測量しようとしています。
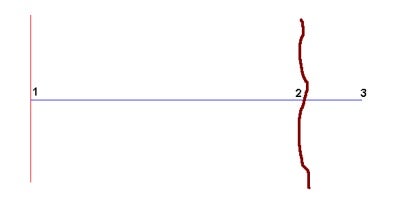
Figure 3 Marking the Water's Edge at the End of Line Only
ユーザは、通常通りスタートラインゲート機能またはCNTL-Sキーを使い測量を開始します。
船が点2の傾斜に近づき、そこより先に行けない時、ユーザはF6キーを押します。図2において示されたものとほとんど同一なWater's Edge Target Parameters画面が、現れます。唯一の違いは、ベアリング(Bearing)が計画測線の測線方向になることです。
ユーザは船から岸線への距離(distance)を入力するだけです。OKボタンを押すとすぐに、プログラムは、岸線位置を計算します。そして、その情報 を生データファイルに書き込みます。このときにイベントマークを生成し、まるでCNTL-Eが押されたかのように現在の測線の収録を終了します。
3. 測線の初めと終わり両方の岸線
図4では、船は点1(堤防の頂点)から点4(もう一方の傾斜面)へ向かう測線を計画しています。
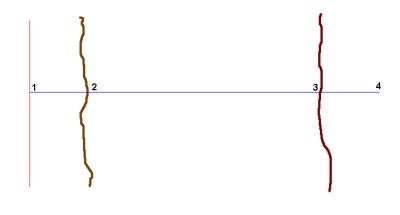
Figure 4 Marking the Water's Edge at Both Ends of the Line.
SURVEYプログラムの状態が収録していない時に船は、点2に移動し、オペレータはF6キーを押します。Water's Edge Target Parameters画面が表示され岸線からの距離を入力します。この情報は、プログラムが収録の状態になるまで、メモリーに蓄えられます。ユーザがOKボタンを押し、Water's Edge Targetが画面に現れるとすぐに測深機記録に注釈が入ります。
CNTL-Sキーを押し収録を開始します。川を横切り点3に出来るだけ、近づきます。ユーザは、傾斜をマークするために、その時F-6キーを押します。Water's Edge Target Parameters画面が再び表示されて、ユーザは船から傾斜への距離を入力します。プログラムは傾斜の位置を計算し それをファイルに保存し、まるでCNTL-Eキーを押したかのように測線を終えます。
Q複数の調査船の使用(Tracking Multiple Vessels in HYPACK)
FAQ ID:Q6-8
あなたは複数の船で観測したいですか? HYPACK(TM)を使用するとそれが出来ます!! Surveyプログラムでの問題発生を避ける為、survey.iniの[DataDisplay]部分の編集をしなければなりません。下記の様に編集及び追加を行ってください:
[DataDisplay]
MaxItems=300
Order=0,1,2,3,4,5,6,7,8,9,10,11,12,13,14,15,16,17,18,19,20,21,22,23,24,25,26,27,28,29,30
Order1=31,32,33,34,35,36,37
Visible=0,1,7
Style=0
Font=-16,0,0,0,400,0,0,0,0,3,2,1,34,Arial
Q共有メモリ(Shared Memory Programs)[英語]
FAQ ID:Q6-9
Memory from the Shared Memory area running with Survey
The release of HYPACK MAX brings a new feature with the SURVEY program call "Shared Memory". Developed by Craig Berry and Lazar Pevac, this new feature allows the SURVEY program to make its information available to other programs operating on the same computer. HYPACK can now share the navigation and targeting data with other applications. Already the MULTISCAN program which provides real time visualization of multibeam and side scan sonar data has been adapted to make use of this feature. Ocean Imaging which makes the GeoDAS side scan sonar and multibeam visualization/targeting program has also adapted their software to be able to get their information through this shared memory area.
"Shared Memory" is a special area in RAM which the SURVEY program can post the latest information. Every time there is a navigation update, the WGS-84 Lat/Long/Ht, local datum Lat/Long/Ht, project X-Y, Hdop, # of Satellites, time tag and other relevant information are posted to the shared memory area. The same is true with depths, tides, heave-pitch-roll, ROV and towfish position and just about any other information relevant to HYPACK. Other applications can access this area for their survey information as fast as they require.
What’s nice about this new feature is that it allows us to write small custom programs without have to make changes to the SURVEY program. For example, in the application to the right, Craig has made a small program which displays the values for the vessel and ROV from the shared memory area. It also contains a graph of the HDOP and # of Satellites. This is a stand-alone executable, meaning it does not effect the SURVEY program in any way.
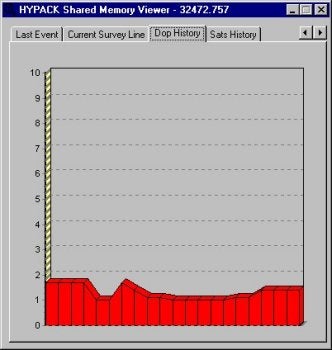
HDOP graph from Shared Memory area.
Already we have created a special program which reads the displayed memory area and allows you to select which items you wish to export, what order you wish them exported, how often to export them and which port to export them over. This will replace a lot of the custom output drivers we have had to develop in the past. We are also building a barge monitoring program which takes the information from the SURVEY program and records it to a user-requested file format. It is a lot faster and more cost effective for us to write a short executable rather than have to try to adapt the SURVEY program to meet everyone’s needs. It also is safer, as we don’t have to mess with the SURVEY program while we try to meet user’s requests.
Qリアルタイムプロット機能(Real Time Plotting in Survey)
FAQ ID:Q6-10
測量中、Surveyプログラムは、リアルタイムに航跡、及び、測深値をプロットすることができます。航跡はボートエディターでボートを作成した際の基点を基準に描画されます。バージョン7.1ではユーザーは、Plotter Setupダイアログによってプロッタの設定を行います。8.1以降のバージョンでは、HardwareプログラムでHP/GLデバイスドライバを選択します。
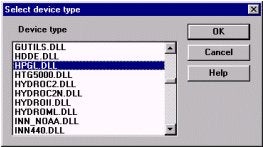
Figure 1: Selecting the plotter driver in Hardware
プロッタは、航跡をリアルタイムでプロットするにはHP/GL互換機を使用しなければなりません。インクジェットプロッタやレーザジェットプリンタも使用可能ですが、航跡のリアルタイムプロットは実行できません。
プロッタドライバをインストールするために、HypackメインウィンドウのメニューよりPreparation – Hardwareを選択します。Hardwareプログラムのメニューより Devices - Add Device Devicesを選択します。表示されたダイアログボックスよりデバイスドライバHPGL.DLLを選択します。 (図1を参照)。OKをクリックすると、Device Setupダイアログが表示されます。名前を付けて、Update Frequencyを1000にセットします。
次に、Connectボタンをクリックしてプロッタに接続します。シリアルポート、パラレルポート、ファイルなど出力先を選択し、Change Settingsボタンをクリックします。ポート設定または保存するファイル名を決定し、OKボタンをクリックします。
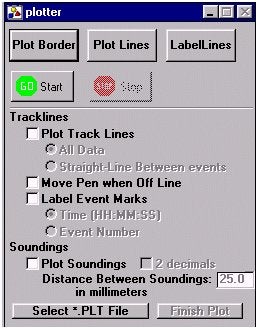
Figure 2: Plotter control window
最後に、Setupボタンをクリックします。ここで、プロッタ起点を選択します。シート左下のコーナー、または、センターを選択し、OKボタンをクリックし、Device Setupを終了します。再度OKボタンをクリックし、Hardwareプログラムを終了します。以上でSurveyにてプロッタを使用することが可能となります。
Surveyプログラムを起動するとプロッタをコントロールするダイアログボックスが表示されます。
Select *.PLT Fileボタンをクリックし、プロッティングシートを選択します。
境界線、計画測線をプロットする場合はウィンドウ上部のボタンをクリックします。
航跡を出力する場合、Plot Track Linesの隣のボックスをチェックします。これによって、航跡全てを出力するかイベントの間を直線で結ぶかの選択が可能となります。Move Pen when Off Line をチェックするとデータ収録を行っていない間(プロッタのペンが浮いている状態)でもプロッタのペンが航跡を追いつづけるようになります。
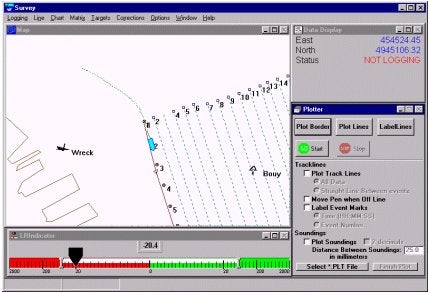
Figure 3: Plotter window in the Survey program
航跡上のイベントマークにラベルをつけることも可能です。ラベルは時間またはイベント番号のいずれかを選択できます。 測深値は、Plot Soundingsボックスをチェックすることによってリアルタイムプロットが可能になります。これにより、小数点2桁の出力、測深ポイント間距離の変化の出力設定が可能になります。
Qオンラインプロット機能(HYPACK 8.9 Online Plotting)
FAQ ID:Q6-11
HYPACK 8.9測量プログラムのリアルタイムプロットの機能を使うために、適合の必要があるいくつかのハードウェアで考慮すべき事があります。
第一に、プロッター用ケーブルです。このケーブルは双方向通信をサポートしている必要があります。ケーブルには RTS-CTS の信号線が必要です。これらの信号線は、プロッターがプログラムに,いつプロッターが過負荷になっているかを知らせます。
これをすることによって、プロッターは、HYPACKから流れる情報量をコントロールすることができます。HYPACKの前のバージョンでは、そういった事例はありませんでした。
8.9へのアップグレードで、我々は、製図ルーチン用Windowsドライバーをもっと活用するためにこれを変えました。
次に考慮すべきことは、パラレルポートが双方向通信に対応しているかどうかです。 これは、ポートを介して情報を受け取れるかを示します。ほとんどのコンピュータは、この設定に問題がないでしょう。
プロッターの問題に直面したら、ケーブルをまず最初にチェックしてください。
それがRTS-CTSの信号線を持っているかを確認して下さい。
もしOKであれば、双方向通信をサポートするパラレル・ポート機能を持っていることを確認してください。
何かご不明の場合は当社にお問い合わせ下さい。
QSurveyプログラムにおけるマトリックスログファイルの使用(Using Matrix Log Files in Survey)
FAQ ID:Q6-12
マトリックスログファイルは、マトリックスファイルの集まりです。不規則な調査エリアでは、それによって調査エリアをスペースの浪費を最小限にするいくらかのマトリックスでカバーすることが可能となります。
Surveyプログラムを起動すると、全てのマトリックスは、グレーの長方形(それらのマトリックスが無効であることを意味します)として表示されます。このとき、全てのマトリックスが"Matrix/Display All Matrices." を選択しているのを確認することができます。マトリックスフレームは、赤くなり、全てのセルが適切な色で塗られます。このオプションは、オフラインモードでのみ有効です。加えて、Display All Matricesを無効にせずにオンラインにすることはできません。これの理由は、プログラムにおいて情報の収集が重要である時に、重いグラフィックオペレーション、及び、メモリ割当を持っていることを望まないことによります。
Surveyが オンラインモードで稼働するとき、マトリックスの状態は、船のポジションによって変わります。その間隔がマトリックスに近いならば(そのマトリックス境界 の10%以内)、マトリックスフレームは、青くなります。それは、データ部分がロードされ、更新可能であることを意味します。ローディングプロセスは、個 別のスレッドにあり、測量を中断することはありません。Surveyではいくつかのアクティブマトリックスを持つことができます。しかし、 Viewableにすることができる(赤いフレームで囲まれる)のは一つだけです。その船がマトリックス境界の内部を走行するならば、そのマトリックス は、Viewableになります。この基準(マトリックスのオーバーラップ)を満たすいくつかのマトリックスがあるならば、船に最も近いセンターを持つマ トリックスがViewableとなります。
オフラインモードにもどると、Surveyは全てのアクティブマトリックスを保存し、それらを無効にします。
QSurveyプログラムのリモート操作(Remotely Controlled Survey)[英語]
FAQ ID:Q6-13S
Imagine you have to perform a survey with one small vessel that is big enough to accommodate pilot and necessary surveying equipment (GPS, echosounder, motion sensor, Left Right indicator, laptop computer).
Obviously, the small vessel is not spending much fuel, it moves easily, does not require any additional crew member. Unfortunately, there is not enough space for somebody to concentrate on the surveying business.
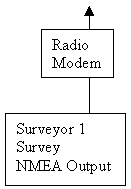
The possible answer is remote surveying with an additional survey unit located on nearby bigger vessel or in a car along the shoreline. The current version of HYPACK® supports such a situation. It requires additional hardware (one computer, two radio modems, one additional comport for moving unit) and software (two device drivers).
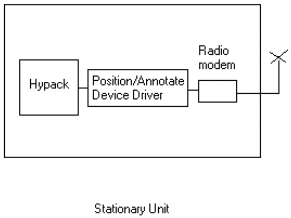
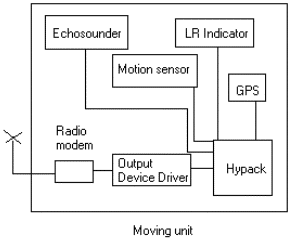
The operator on the Moving Unit can see only the left/right indicator and eventually the on/off line signal. His goal is to keep the left/right position as close to the center as possible. The surveyor in the Stationary Unit receives positions from the Moving Unit and makes the decision to start/suspend/end the survey. Every event ( start/end survey, switch/swap line) on the Stationary Unit is forwarded to the Moving Unit and interpreted by the output device driver.
It is important to note that the Moving Unit receives and saves all surveying data. The question is would it not be cheaper to get rid of HYPACK® on the Moving Unit and send all data by radio modem to the Stationary Unit.
Obviously, it is cheaper but we are going to make the radio modem very busy and that can result in loosing some data. Additionally, the operator on the Moving Unit is not going to have a left/right indicator position which might cause wasting of surveying time.
Qサーベイノート(Survey Notes in MAX)[英語]
FAQ ID:Q6-14
This note is regarding the Target Editor as well as notes recorded by Survey. The problem arose when a survey crew spent a full day collecting targets. At the end of the day it was realized that there was a target that needed to be added to the list. The surveyor took the target file and opened it in the Target Editor program. He then elected to insert a target to the beginning of the file. This caused a line to be inserted at the beginning of the target list. The next step is where the problem came in. He chose to add the point with the cursor. This caused the program to clear the list of targets previously held in the file and start a new list. Once he was done adding targets the surveyor saved the file. He did not notice that the targets had been removed.
Now that we have found that the targets have been removed we can figure out a way to recover a days worth of work. This is the Survey Notes I referred to earlier. A short time ago one of our programmers wrote a function into the Survey program. This function writes a text file for every day that you run the Survey program. I am going to include a sample to show what is recorded.
The following is an example with a short description of each item.
<10:42:59> PROJECT NAME: Ross_Island
<10:42:59> PROJECT DIR: C:\HYPACK\Projects\Ross_Island\
>> Header to let you know what project this file is from.
<10:42:59> Using Line 1 from C:\HYPACK\PROJECTS\ROSS_ISLAND\
LINE1.LNW
>> Lists the current line file in use.
<10:42:59> No Matrix File selected
>>Lists the Matrix file Selected
<10:42:59> Opening Data File C:\HYPACK\Projects\Ross_Island\
RAW\001_1042.RAW
>> What time was the line started to be recorded.
<10:42:59> Event #1
>>Event #1 occurred
<10:42:59> NMEA Warning: No Sync
>> The Position was set to Sync Clock and it failed.
<10:43:00> XTE Limit = 20, XTE = -2247890
>> The cross track limit was exceeded
<10:43:15> Closing Data File C:\HYPACK\Projects\Ross_Island\
RAW\001_1042.RAW
>> Closing the data file
Later that day the Survey was continued and the following is also a section recorded in the same file. Everything that happens in Survey is written to a single file for each day. This section is appended to the file with an empty line separating the data segments. The important part of this file is that we recorded a group of targets. You can see that the time and X,Y of each target is recorded in the file. Luckily the surveyor from my example was able to recover the targets by using this file. There is no substitute for taking good notes and this is a prime example of it. We took notes without even knowing how important it would become.
<14:25:07> PROJECT NAME: Ross_Island
<14:25:07> PROJECT DIR: C:\HYPACK\Projects\Ross_Island\
<14:25:07> No Line File selected
<14:25:07> No Matrix File selected
<14:25:07> Opening Data File C:\HYPACK\Projects\Ross_Island\
RAW\000_1425.RAW
<14:25:07> Event #3
<14:25:07> NMEA Warning: No Sync
<14:25:08> Event #4
<14:25:08> Closing Data File C:\HYPACK\Projects\Ross_Island\
RAW\000_1425.RAW

<15:00:25> Target 15:00:25 (1016871.17, 740807.55)
<15:00:25> Target 15:00:25 (1016871.17, 740807.55)
<15:00:26> Target 15:00:26 (1016871.17, 740807.55)
<15:00:26> Target 15:00:26 (1016871.17, 740807.55)
<15:00:26> Target 15:00:26 (1016871.17, 740807.55)
<15:00:26> Target 15:00:26 (1016871.17, 740807.55)
<15:00:27> Target 15:00:27 (1016871.17, 740807.55)
Qサーベイプログラムの自動処理(Procedure for Automatically Starting the Survey Program)[英語]
FAQ ID:Q6-15
This procedure is intended to allow a user to configure a project in the HYPACK MAX software and then start recording position data automatically without any user intervention. This is to recover from a loss of power and start logging data as soon as the computer is restarted. It was originally devised for a customer who wanted to set up three RTK-GPS receivers on a building to monitor movement during an earthquake. Because of the risk of loss of power, this procedure necessitated the startup and logging of data within the Survey program as soon as the PC was booted up.
The first requirement is that the user has configured a project with the parameters and names for that project. In this demonstration, I named the project Hong Kong. The Geodetic Parameters and Hardware must be configured as you would in any Hypack project.
The project must have a Planned Line file. All you really need is a single short line to automatically log data upon entering Survey. For a stationary GPS, you should create this line as short as possible and as close to the GPS antenna position as possible. In this demonstration, I created a single planned line 20 meters long. The GPS antenna was situated around the centerpoint of the line file as shown below.
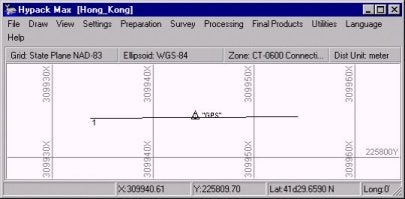
Survey's Start Line Gate must be set to a value greater than the distance from the antenna to the line file. In order to log automatically upon entering Survey, the Start Line Gate should be greater than the line length. In this case, the line length is only 20 meters. I set the Start Line Gate to 100. This will allow the program to automatically start logging when the program is started.
To set the Start line gate the user must enter the Survey program and modify the Navigation Parameters. Once this is set the user cannot exit Survey without resetting this to zero because the Survey program will not allow the user to exit without stopping logging. The program will continue to restart the logging function as long as the GPS is within the start line gate distance. The Navigation Parameters are shown below.
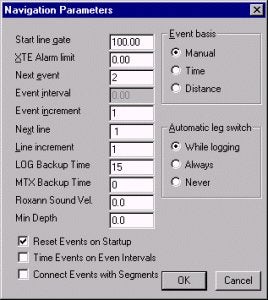
Another parameter that should be set is the Log Backup Time. This is also set in the Navigation Parameters. This should be set to an interval consistent with the project requirements. This configures the software to close the datafile after the predetermined period and start a new datafile. You will notice I set the LOG Backup Time to 15. Survey will close a datafile and open a new file every 15 minutes. This keeps files much smaller, and in the case of loss of power, computer crash, etc., only 15 minutes of data would be lost, rather than a whole day's worth.
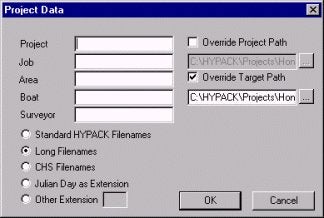
If LOG Backup time is used, Long Filenames should be selected in the Project Information menu of the Survey program as shown below.
The next Item to create is the shortcut. This is done in either Windows Explorer or by selecting the drive through My Computer. Find the Survey32.EXE program in the HYPACK folder on your computer.
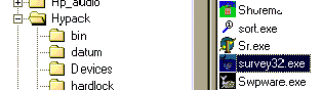
The user can then create a shortcut to the Survey32 program by right clicking on survey32.exe, and then clicking on Create Shortcut.
Next we have to Edit the Shortcut. Right click on the shortcut. On the menu that appears the user should select the Properties menu item.
To modify this the Target parameter should be modified. The correct method of launching a program is to add the project and project.ini to the path.
Example: C:\HYPACK\survey32.exe /pProjectName /iProjectName.ini
In this example, the target should look like this:
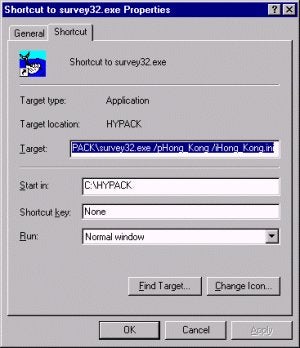
C:\HYPACK\survey32.exe /pHong_Kong /iHong_Kong.ini
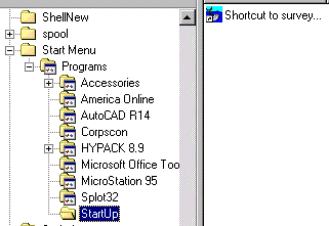
The last step in the procedure is to add this shortcut to the Start Menu. This shortcut must be added to the Startup item on the Start Menu to allow the program to automatically start when Windows boots up. You can do this in Windows Explorer. Just drag this shortcut into the \Windows\Start Menu\Programs\StartUp directory as shown below.
Once these steps have been completed the user will have a system that automatically recovers from a loss of power and restarts Survey. It will also automatically start logging data upon reboot.
QSurveyプログラムのWindowメニューでTSSのデータを確認すると正しく来ているのに画面下に"Heave"と赤く表示されるのはなぜでしょう?
FAQ ID:Q6-4
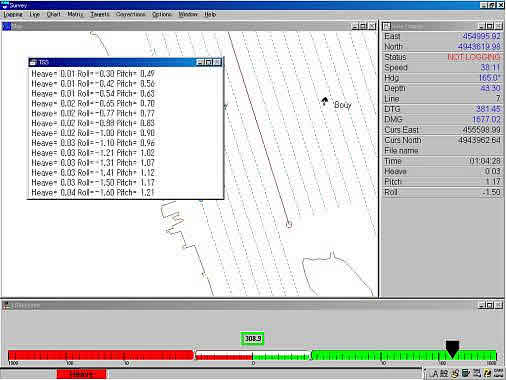
HYPACKを終了し、DMSView又はターミナルソフトを使用してTSSからのデータを見て下さい。
データ中に含まれているフラグが小文字になっていませんか?(下図参照)
これは、何らかの原因でセルフテスト実行中である事が考えられるので大文字の"U"になった後に測量(Survey)を開始して下さい。
| 023DE7-0007u 0023 | 0038 |
|---|---|
| 023DF6-0007u 0016 | 0041 |
| 053E1C-0007u 0009 | 0044 |
QHypackのアノテーション処理(How HYPACK® Selects Depth Info for Annotation to Echosounders)[英語]
FAQ ID:*Q6-16M
There is occasional confusion amongst the users who try to compare the depth annotated on the echogram with the corresponding depth shown at the fix in the SINGLE BEAM EDITOR of HYPACK®. It's a little disconcerting when you are going up a slope and read a depth of 12.9 on the echogram and then load the same file up in the SINGLE BEAM EDITOR and see a depth of 14.3 at the same fix mark.
The difference you see is due to the time correlation that the SINGLE BEAM EDITOR performs when matching depth and position information.
In the SURVEY program, we have positions arriving every second and depths arriving ten times per second. In our example, there is a one second latency (delay) from when the measurement of position was made until it is delivered to the computer. For the echosounder, we have a tenth of a second latency.
Thus, when the computer clock reads 12:05:07.0, it is receiving the position from 12:05:06.0 and the depth from 12:05:06.9.
Many users generate event marks (also called "fixes") using a distance along line. For example, you may decide to generate a fix mark every 25' down the survey line. It is important to note that the SURVEY program does not perform any prediction as to when it crosses each 25' point. It just processes each position as it arrives. If it places the vessel at or beyond the fix point, an event mark is then generated.
For the annotation string that SURVEY generates for the echosounder, it just takes the last depth received and inserts it in the text string sent for the annotation.
In the figure above, the SURVEY program receives a position fix at 12:05:07 (computer clock). Since we have a one second latency, this is actually the position from 12:05:06 (Item 1). This position triggers an event mark. SURVEY takes the last depth received, from 12:05:06.9 (Item 2) and places it in the annotation string sent to the echosounder.
Later on while processing the data file is read into the SINGLE BEAM EDITOR, the program will see it has a depth at 12:05:06.0 (Item 3 in our time line) and assign it to the correct position at 12:05:06.0 (Item 1 in our time line). Although the depths read in the SINGLE BEAM EDITOR at the fix marks may not be the same as those viewed on the echogram, the important point is that THE DEPTHS IN THE SINGLE BEAM EDITOR ARE 100% CORRECT AS TO THEIR TIME AND POSITION.
A possible solution to the above problem would be for us to buffer depths in each device driver to allow the program to retrieve a depth from the time of the position measurement. In this case, the depth on the annotation string would match the depth in the SINGLE BEAM EDITOR. The downside would be that the depth annotated on the echogram would not correspond to the analog depth on the echogram at the time of the fix.
Q複数の調査船の使用(Multiple Vessel Tracking in HYPACK® MAX)[英語]
FAQ ID:Q6-17M
I recently was asked by a customer how does a customer track multiple vessels on the screen in HYPACK MAX. I created a demonstration project to display two survey vessels and a dredge on one screen so that the operator can monitor the progress of all vessels.
When I was creating this demonstration I found a new use for a feature in Survey. By right clicking on a vessel you can assign that vessel to the Main Vessel. When you do this the survey screen will shift to always keep that vessel in the Map window.
To connect all of the vessels to one computer you need to have radio modems connected to each vessel to be monitored, and a modem connected to the monitor station for each vessel that will be tracked.
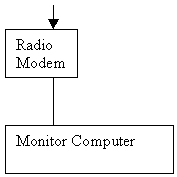
If there are several vessels to be monitored the monitor computer is going to need a serial port for each radio modem. Another key thing to remember is each radio modem pair must have a distinct frequency.
On the monitor computer the HYPACK Hardware program is configured with multiple NMEA devices and multiple mobiles ( one for each vessel ). In Survey you can then see each vessel on the screen as it moves independently from the other vessels. Only the main vessel can be used to record data. The data from other mobiles will be saved to files but those values will not be used to fill a matrix in Survey.