HYPACKに関する質問
2.測量準備と補正(Preparation & Calibration)に関するFAQ
QRTK GPSによる潮位補正(Using RTK GPS in HYPACK for Real Time Water Levels)[英語]
FAQ ID:*Q2-2
Summary: Real Time Kinematic (RTK) GPS receivers can measure the latitude, longitude and height above the WGS-84 reference ellipsoid to within a few centimeters. Using this vertical accuracy, users can determine water level corrections (tide corrections). This eliminates the need to use conventional tide gauges or to assign personnel to monitor tide staffs. Users must establish their own RTK base station to supply differential corrections to the boat-GPS. In addition, users must pre-determine the separation between the WGS-84 reference ellipsoid and the appropriate chart datum in their survey area.
This paper provides a step-by-step explanation of using RTK GPS to obtain real time water levels in HYPACK(TM).
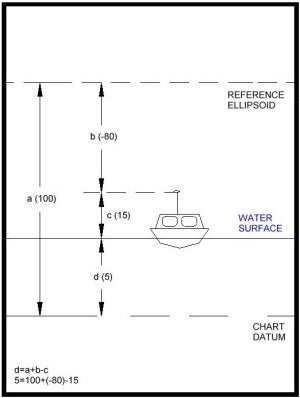
Figure 1: HYPACK(TM)'s method of obtaining real time water levels
Methodology
The figure to the right shows a survey boat using RTK GPS to determine the current water level correction.
Our measurements show the antenna height to be 15m above the static water line. This is the value (c) in the figure. c = 15.
The RTK GPS is reporting that the GPS antenna is 80m below the reference ellipsoid. This is value (b) in the figure. b = -80.
If we can determine how high the reference ellipsoid is above the chart datum [value (a)], we can then solve for the water level above the chart datum [value (d)].
In our example, we have pre-determined the reference ellipsoid is 100m above the chart datum. How we determined this is explained in the next section. From the diagram we can see that:
d = a + b - c
d= (100) + (-80) - 15 = 5m
Where (d) is the height of the water surface above the chart datum.
(a) is the height of the reference ellipsoid above the chart datum.
(b) is the height of the GPS antenna above the reference ellipsoid. This is supplied by your GPS.
(c) is the height of your GPS antenna above the static water line.
When correctly configured, HYPACK(TM) computes this value at each RTK GPS update and saves the position and a tide correction to the raw data file. The sign of value (d) is negated by HYPACK(TM) to be consistent with our normal tide correction values.
When the RAW data file from the SURVEY program is read into the Multibeam editor, each sounding will have an RTK Tide correction, based on the method shown above.
Determining the Separation between the Reference Ellipsoid and the Chart Datum
Before you head out on the water to start your survey, you need to determine the separation between the WGS-84 reference ellipsoid and the local chart datum. If your survey is conducted in a small area, you may need only a single point. If your survey is conducted over a large area where the separation between the ellipsoid and chart datum changes, you will need several points to Amodel@ the difference.
The following steps should be taken at each location to determine the separation between the reference ellipsoid and the chart datum.
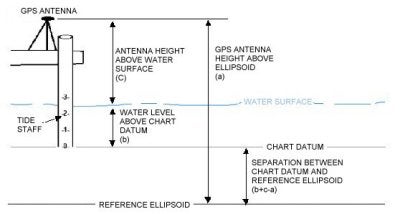
Figure 2: Determining the separation between the reference ellipsoid and the chart datum
Set up your GPS adjacent to your tide staff. The staff should be referenced to the local chart datum.
Write down the water level from the tide staff (b).
Measure the distance from your GPS antenna to the water level surface (c).
Once your GPS is stable and in RTK mode, write down the height of the GPS antenna above the reference ellipsoid. This is normally contained in the GGA and GGK messages. It might also be available on the front data display of some GPS. You should take care to note whether your GPS provides this value in feet or meters. If you are measuring depths in feet, you will need to convert the ellipsoid height of your antenna to feet. (1 meter = 3.280833333 feet). Record this value (a).
The height of the reference ellipsoid above the chart datum is equal to (b)+(c)-(a). In the diagram above, the reference ellipsoid is below the chart datum, so we would expect to get a negative number. The value will be a positive if the reference ellipsoid is above the chart datum and negative if the reference ellipsoid is below the chart datum.
Creating a KTD File
A Kinematic Tidal Datum (*.KTD) file is used in real time by the SURVEY program to determine the separation between the reference ellipsoid and the chart datum at the vessel location. This is used in cases where the separation between the two surfaces actually changes, depending on your location.
If the separation between your reference ellipsoid and chart datum is a constant, or if you are surveying in a small area and only want to use a single separation value, you do not need to make a KTD file. This is a new version of RTK Water Level implemented in HYPACK(TM) Version 8.1.a. and later. Details are presented in the next section.
To create a KTD file:
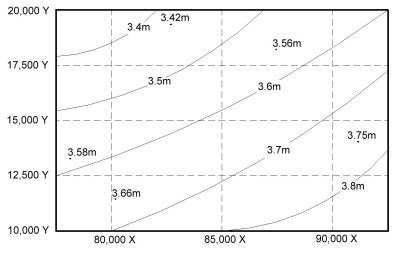
Figure 3: Separations: Ellipsoid above Chart Datum
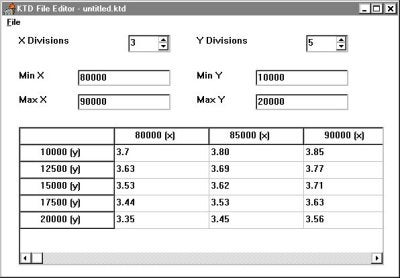
Figure 4: KTD File Editor
Plot your survey area on a piece of paper.
Plot the location of your tide stations, where you have determined the separation between the reference ellipsoid and the chart datum. Write the separation values next to each gauge.
Draw a rectangular grid around your survey area. This is the border of your KTD file. Make a note of the lower left X-Y and upper right X-Y coordinates. They will be needed when you create the KTD file.
Determine how many "nodes" you want in each direction. See the diagram to the right for an example. In this case, there are 3 nodes in the X-direction and 5-nodes in the Y-direction.
Contour the separation data, as shown in the figure to the right.
Determine a separation value at each node, based on the contour information.
Start the KTD File Editor. This program is only available in the 32-bit version of HYPACK(TM).
Enter the maximum and minimum values for your X and Y coordinates. These were obtained in step C.
Enter the number of nodes (or divisions) in each direction. The spreadsheet below will change to reflect the number you have entered.
Enter the separation value for each node in the appropriate grid.
When finished, click the File - Save and save the file to a KTD file. KTD files can be saved anywhere, but we normally put them in the \COASTAL directory.
In version 8.1 of HYPACK(TM) and earlier, users would enter a combined value that had the separation minus the static GPS antenna height. In Version 8.1.a. of HYPACK(TM) and later, you do not include the antenna height in the value entered in the KTD file. The TRIMKIN.DLL and KIN.DLL will obtain the antenna height from the offset information contained in the driver configuration.
Operating without a KTD File
As we mentioned before, a KTD file is only necessary if you are in an area where the separation between the reference ellipsoid and chart datum is not a constant. If the separation is a constant, or if your survey area is so small, you don't need more than a single value, you can operate without a KTD file.
You can "fool" the system by entering the combined value of your antenna height minus the height of the reference ellipsoid above the chart datum as the height in the "Offsets" window in HARDWARE for theTRIMKIN.DLL and KIN.DLL. This approach is only valid in HYPACK(TM) Version 8.1.a and later versions.
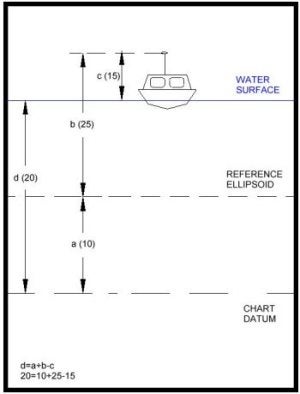
Figure 5: Operating without a KTD File.
For example, in the figure to the right, the antenna measures 15m above the static water line. The reference ellipsoid is 10m above the chart datum. We would enter 5.0 (15.0 - 10.0) as the antenna height and would not specify a KTD file.
While surveying, the SURVEY program receives a measurement from the RTK GPS, which shows the antenna is, located 25m above the reference ellipsoid. Since there is no KTD file, the program will assign zero to the separation value (a). Using our formula:
d = a + b - c
d = 0 + 25 - (5)
d = 20.
Using this technique, you don't have to mess with KTD files.
Setting up the Device Drivers to do RTK Real Time Water Levels
The KIN.DLL (Kinematic GPS) and TRIMKIN were written to provide real time water level capability in HYPACK(TM). You should configure them as you would any other GPS driver, with the following exceptions.
Make sure you have checked the "Tide" entry in the Type box. Otherwise, the driver will not perform the calculation to obtain a real time tide correction.
If you are using a KTD file, you need to select the KTD file in the Setup box.
・Make sure you specify the antenna height in the Offsets window. If you are using a KTD file, enter the height of the GPS antenna above the static water line. If you are working without a KTD file (see the section above), enter the height of the GPS antenna minus the height of the reference ellipsoid above the chart datum as your Antenna height.
Calibrating your Echosounder
In HYPACK(TM) version 8.1.a. and later, you should always calibrate your echosounder so the depth sent to the computer includes the measured depth from the transducer to the bottom, plus the transducer draft correction. In HYPACK(TM) version 8.1 and previous, you needed to have your echosounder output only the measured depth from the transducer face plate to the bottom.
Processing RTK GPS Data with Water Level Data
Provided you have correctly set up your survey to record real time water level corrections, processing is simple. The EDITOR program can read the raw format data file and use the TIDE records contained in the file automatically.
In the "Read Parameters" window, users can find the "Advanced" button. Clicking this button brings up access to the RTK Tide parameters. If the user clicks the RTK Tides check box, the EDITOR program will then use the RTK TIDE records written in the raw data file for tide corrections. This will activate the two options on how the program combines RTK water level elevations with heave corrections. The two choices will read:
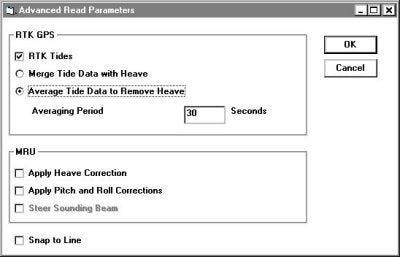
Figure 6: "Advanced Read Parameters" dialog box in the Editor program.
Merge Tide Data with Heave
Average Tide Data to Remove Heave
The "Merge Tide Data with Heave" uses the RTK elevations as vertical "anchors". Between the GPS elevation updates, the program "fits" the heave data to predict the change in vessel movement.
The Average Tide Data to Remove Heave averages the RTK elevations over a user defined time period to obtain a "normalized heave plane". In theory, this average vertical level should be the zero plane as defined by the heave-pitch-roll sensor. The program then applies the exact heave corrections to the data to obtain the exact vessel position at the time of the depth measurement. A time period of 30 seconds seems to work quite well.
Editing RTK GPS Data with Conventional Tides
Users can process raw data files that have RTK water level corrections using conventional tides by simply reading a TID file while in the EDITOR spreadsheet. This allows you to process the data using RTK water levels or conventional tide corrections and then compare the results in the CROSS SECTIONS program (or in the EDITOR profile screen by using the Overlay feature).
QRTK GPSによる潮位補正2(A Discussion of RTK TIDES)[英語]
FAQ ID:Q2-3
We have been having a lot of internal discussions regarding the computation of RTK Tide Corrections and their comparison to Measured Tide Corrections. This article presents our current thinking on the subject and illustrates how we are computing and applying the corrections.
1. First – The Basics
The figure to the right shows all of the components needed to compute the Chart Sounding (CS = the distance the bottom is beneath the Chart Datum).
Using conventional survey techniques we have always added the various corrections to the measured depth from the echosounder to obtain the chart sounding. In this example, we have calibrated our echosounder to the surface. The formula would be:
CS = B + T1 + D
CS = 30 + (-10) + 0 = 20.0
where: T1 = Conventional Tide Corr.
B = Measured Sounding
D = Dynamic Draft Meas.
The basics behind the computation of RTK Tide is that we can use the z-value of our GPS antenna to determine the tide correction in real time.
Assuming the vessel is not pitching and rolling (which adds another level of difficulty), we can compute the RTK Tide Correction (T2) as follows:
T2 = -K + N – A + H – D
T2 = -4 + 9 – 22 + 7 – 0 = -10.0
where: K = Height of the Geoid Above the Chart Datum
N = Height of the Geoid Above the Ellipsoid Reference
A = Height of the RTK Antenna Above the Ellipsoid Reference
H = Height of the RTK Antenna Above the Boat Origin Point
D = Dynamic Draft Measurement
The K component comes from an KTD (Kinematic Tidal Datum) file created by the user.
The N component is actually the height of the Geoid Above the Ellipsoid (as read from the Geoid99 model in real time) plus an orthometric correction specified in the Geodetic Parameters program. If the user does not have access to a geoidal model of their area, they should create the KTD file so that it contains K - N values. This would represent the height of the chart datum above the reference ellipsoid.
The A component comes from our RTK system. This is provided anywhere from 1Hz to 10Hz by different GPS systems and broadcast as a part of a GGA or GGK or other message. Every time the KINEMATIC.DLL device driver receives a position update, it computes the new position, along with a new RTK Tide value.
The H component is the static height of the RTK Antenna above the water line. In order to maximize accuracy, this measurement should be taken at the same time you calibrate your echosounder to the surface. In theory, this should be measured to the same point (boat origin = static waterline) that you are using to calibrate your echosounder. In actual practice, it’s not practical to measure the antenna height out in the middle of the channel when you are doing a bar check. It is suggested that you measure the antenna height when the vessel is at the dock and place a mark on the hull to denote the static waterline. Then make an adjustment to the antenna height when you calibrate the echosounder by noting the change in height of the waterline relative to the mark.
The D value represents the vertical movement of the transducer in the water column and is called the Dynamic Draft Measurement. This movement can be caused by a lot of reasons. As you take on more fuel, the vessel can sit lower in the water. Due to squat and settlement, the vessel can have a drastically different position in the water when it is moving that when it is stationary. Some vessels, such as hopper dredges, have pressure transducers that allow us to constantly measure the current draft. Other survey vessels use the DRAFTTABLE.DLL that allows them to construct a table that is used to assign the draft based on the vessel speed. Other survey vessels assume the draft to be a constant and ignore any dynamic effects.
2. Underway – Dynamic Draft Sensor
Now we are driving are vessel over the same bottom that was used in the first example. The tide is unchanged, but due to squat and settlement, the vessel is sitting 1.0 lower in the water column.
Let’s first examine the values that have changed.
A = 21
D = 1
B = 29
All other values are the same.
Computing the RTK Tide:
T2 = -K + N – A + H – D
T2 = -4 + 9 – 21 + 7 – 1 = -10.0
This is correct, as the tide has not changed. Our chart sounding is:
CS = B + T2 + D
CS = 29 + (-10) + 1 = 20.0
In this case, the RTK Tide continues to equal the traditional tide correction (T2 = T1).
3. Underway – No Dynamic Draft Sensor
Now let’s look at the last case again, but this time we do not have any dynamic correction to the draft. We set it for 0.0 (calibrating the echosounder to the surface) and left it there.
Now, the values are the same as in the previous example, except:
D = 0.0
When we compute the RTK Tide (T2):
T2 = -K + N – A + H – D
T2 = -4 + 9 – 21 + 7 – 0 = -9.0
Using the RTK Tide to compute the chart sounding:
CS = B + T2 + D
CS = 29 + (-9) + 0 = 20.0
We still get the correct answer! What you must note (and something I have only recently learned) is that the RTK Tide correction that is computed in this case is not equivalent to the conventional tide correction (T2 ≠ T1).
If we used the conventional approach in this example, the computed chart sounding would be:
CS = B + T1 + D
CS = 29 + (-10) + 0 = 19.
In this case, the RTK Tide result is more accurate than the conventional result. RTK Tides has compensated for the squat and settlement without any measurement of the change in draft. This compensation is built into the RTK Tide value, resulting in it no longer being equivalent to the conventional tide value.
Summary:
The important points of this case are:
When using RTK Tides, you should always calibrate your echosounder to the static waterline.
You should measure the height of the GPS antenna above the water line at the same time you calibrate the echosounder. As a minimum, adjust the GPS antenna height based on the change in draft from when you measured the original antenna height to how the vessel sits during the echosounder calibration.
RTK Tides will generate an accurate chart sounding, whether you apply a real time draft correction or not.
If you apply a real time draft correction, the routine in the KINEMATIC.DLL subtracts the dynamic draft correction in order to compute the ‘true’ tide correction. Absent a dynamic draft correction, the RTK Tide method will still result in an accurate chart sounding, but the user must realize that the RTK Tides values and conventional tide values will not be equal.
If your vessel is prone to squat and settlement or sits differently due to fuel loading, you may want to consider the RTK Tide approach being superior to the conventional tide approach.
QDXFファイルを測線ファイル(*.lnw)へ変換(Reformatting DXF files to Planned Line Files in Reformat)
FAQ ID:Q2-4
ユーザーは、DXFファイルをHYPACK(TM) Planned Line(計画測線) ( *.lnw )ファイルに変換することができます。AutoCAD、または、他のCADパッケージにおいてあなたの計画測線を設計し、そして、これらをLNWファイルとして使用することができます。
作成されたDXFファイルをただしくLNWファイルに変換するために、さ区政された測線は、 PLANNEDLINESと指定されたレイヤーに位置している必要があります。このレイヤーには変換しないオブジェクトは載せないようにしてください。図 1は、AutoCADで作成した水路と測線を示しています。
Figure 1: AutoCAD dxf drawing
HYPACKのメインウィンドウで、Final Products – Exportを選択します。いったん、そのプログラムがアップし、そして、起動した画面のConvert Fromリストから*.DXFを選択します。一度DXFファイルを選択すると次からSelected Filesリストに自動的に表示されるようになります。File – Convertを選択すると変換後の測線ファイル名を指定するように促されます。Saveボタンをクリックすると変換が実行されます。
Figure 2: HYPACK(TM)’s Reformat program
これらのラインファイルはテンプレート情報を全く持っていないので、個々のテンプレートを作成せずに体積計算をすることはできません。
Figure 3: LNW file created in Reformat program
QHypackにおけるシリアルポートの利用(Serial Port Handshaking)
FAQ ID:Q2-5
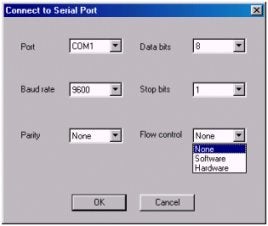
Serial Port Connect Dialog
HYPACK MAXのバージョン00.5は、様々なシリアル機器が対応できるようにハードウェアプログラムをバージョンアップしています。変更の大部分は、目に見えるものではありません。重要なのは次の点です。
HYPACK MAXでは、ハンドシェイク全てがNoneにセットされることが好ましいです。そうすれば、測定が行われると直ちに、それがそれ以上遅れることなくコン ピュータに転送されます。やむをえない理由のない限り、プロッタを除いて全ての装置は、ハンドシェイクに設定しないでください。
あなたの装置にハンドシェイクが必要な場合、その装置がどのようなハンドシェイクのシステムを使うかを決定してください。以下の3つのタイプがあります。
- Xon/Xoff
- CTS/RTS
- DTR/DSR
ハンドシェイクの方法によってシリアルポートのコネクタダイアログで設定するフローコントロールが決定します。そして、場合によってはカスタムケーブルを必要となります。
| Handshaking Method | Flow Control | Cable |
|---|---|---|
| Xon/Xoff | Software | 標準 |
| CTS/RTS | Hardware | 標準 |
| DTR/DSR | Hardware | カスタム |
HYPACK MAXは、シリアル通信ダイアログにおける設定を調整することによって大部分のハードウェアと通信することができます。 そこにまだハンドシェイクのDTR/DSR方法を要求する2、3のデバイスがあります。HYPACK MAXは、通常、CTS/RTSハンドシェイクをサポートしており、それによりコネクティングケーブルの調整が行われることになります。2本のワイヤは、 HYPACKのRTSピンがデバイスのDSRピンと接続し、HYPACKのCTSピンがデバイスのDTRピンと接続するようにしなければなりません。
| HYPACK® | Connection | Device |
|---|---|---|
| RTS |  |
DSR |
Q曲線を含んだ測線の作成(Curved Survey Lines in the Line Editor)
FAQ ID:Q2-6
HYPACK MAXのLine Editorでは円弧形の誘導測線を扱うことができます。 円弧形誘導測線を作成するには、まず直線の場合と同様に始めます。マウスかLine Editorテーブルを使って何点かのポイント入力を行ないます。これらのポイントは自動的に線分で結ばれます。
いったん真っ直ぐな線が作成されたら、任意の線分に湾曲を加えることができます。
- Line Editorで、カーブの始まる点において一列目の影の部分をクリックします。すると、選んだ線分に対して、範囲を入力するダイアログボックスが開きます。
- 範囲の入力
- ダイアログ内に数値を入力します。任意の値が入力できますが、線分長の半分以上の値を入れてください。半分以下の場合、弧は作成されません。
- 範囲の正/負の値は、それぞれ作成される円弧の中心が線分の右/左になります。
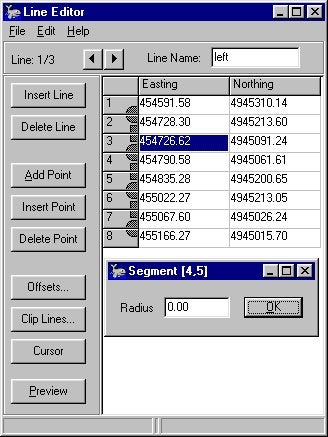
Line Editorにおいて、円弧を作成した位置は一列目の影の部分が楕円形になっているのが容易にわかると思います。
円弧形誘導測線に対してもOffsetsの操作はサポートされています。円弧形誘導測線を中心として、セクションラインを作成することができます。追加で 平行(parallel)・回転(rotated)・階段移動(shifted)の測線を作成できます。Clip Linesのオプションは円弧形誘導測線に対してはまだサポートされていません。将来的には直線の場合と同様にクリップされた円弧が作成できるようになる でしょう。
Q水路設計(チャンネルデザイン)プログラムでの測線ファイル(*.lnw)の利用(Channel Design Center Line Import)[英語]
FAQ ID:Q2-7
The change that was made to Channel Design was not driven by a customer request, but by a desire to provide an easier method of creating a channel file. You can now import a .LNW file, created using the centerline method in the Line Editor, into a Channel Plan file (*.PLN). This allows you to create a line file and clip it to a known channel. You can then quickly modify this into a Channel Plan file that includes template information for volumes calculations. The procedure is outlined below.
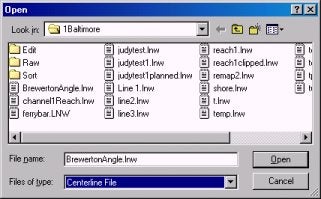
- Create a Line File using the centerline offset pattern in the Line Editor. I chose a BSB chart to provide my channel for this demonstration. The survey lines cover the area. You do need such tight line coverage to create a nice channel.
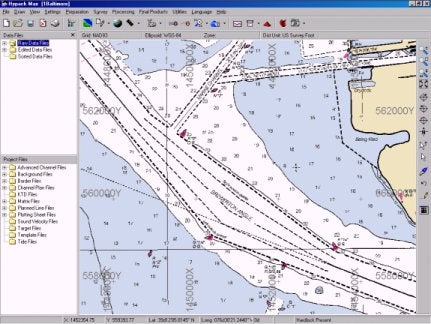
- Clip the lines to your channel using a Border file and the Clip Lines feature in the Line Editor.
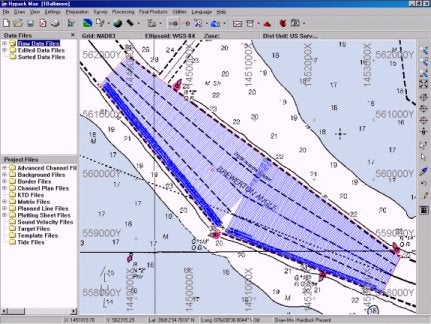
- Open the Line file you have just created in the Channel Design program. When the program reads the file, it uses the first line in the file as the centerline of our channel. Once the line is read, it behaves just like a normal plan file.
The start and end points of each line are used to create the left and right toes. Since there are more lines in the file than it requires to create the shape of the channel, the program eliminates points where three or more are in line with each other (using a one foot tolerance). This reduced the original 235 lines created in the Line Editor to 4 left toe points, 3 center line points and 2 right toe points.
Now we have defined the channel using the centerline file, but we do not have a line file with the template data yet.
- Edit depth, slope and chainage according to your channel. The defaults are:
- Depth: 20
- Slope: 3
- Chainage: 0
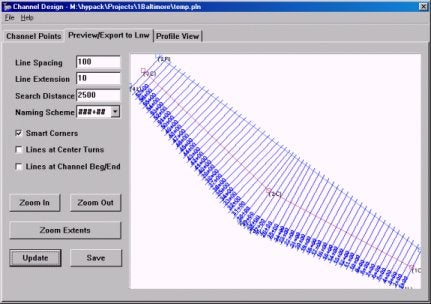
- Create a channel by clicking [Update]. In this example, I have used Smart Corners to fill the gap that we saw at the curve in the original line file. The channel created should have all of the correct settings with template information that can be used to compute volumes and we have coverage on the curve.
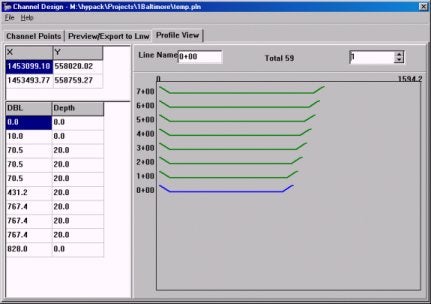
- Check your channel templates using the Profile View to make sure that all of the templates look good and that the channel was created correctly.
- Return to the Preview Tab and save your new Line File by clicking [Save] and naming your file.
Q水路設計(チャンネルデザイン)プログラムにおける急な変化を含むトウラインの処理(Channel Design with Sharp Turns in the Toe Lines)[英語]
FAQ ID:Q2-8
A client recently had trouble creating an LNW file using the CHANNEL DESIGN program. The problem end of the channel is shown in the figure to the right.
The Left Toe line is shown at the top of the figure in blue, with points 2L, 3L and 4L being visible. There is a 90º turn at each point.
When the planned lines were generated in the CHANNEL DESIGN program, the result is shown in the figure right.
At first glance, it appears that lines 8+80, 9+00 and 9+20 have been extended too far from the left toe line and are erroneous.
It turns out the CHANNEL DESIGN is doing a pretty good job in this case! Take a look at the figure to the right.
One of the first things that CHANNEL DESIGN does is to construct the Left and Right "Top of Bank" lines. These are constructed from the positions of the toe lines and the side slope information. The Left Top of Bank line is shown in red at the top of the figure.
CHANNEL DESIGN is smart enough to be able to handle the 90º turns and generate the correct top of bank line.
For each planned line, the program then checks to see where it crosses the "toe line" and where it crosses the "top of bank" line.
As a test, I changed the Side Slope on the left side of the channel from "2" to "0.5". This would result in a "steeper" bank and the Top of Bank line should be generated closer to the Left Toe Line, eliminating the "long" lines at the end of the channel.
The figure to the right shows the result, confirming the fact that CHANNEL DESIGN is working as designed in this case.
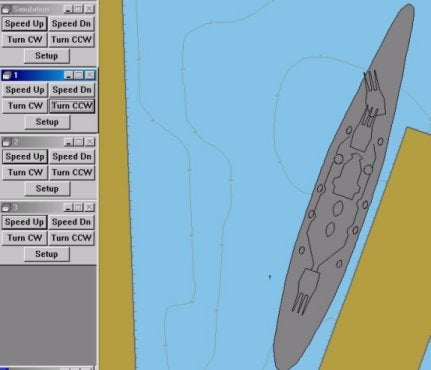
Q複雑な調査船の作成
最新のBoat Shape Editorでは複合的なボート形状を作成することができます。そして、Surveyプログラムにおいて作成したボートを表示することができます。そし て、作成したボートの色とラインカラーを指定することができます。また、どこでそれらのアンカーが位置しているかを示すアンカーポイントを設定することも 可能です。設定したアンカーは、Surveyプログラムで表示することができます。
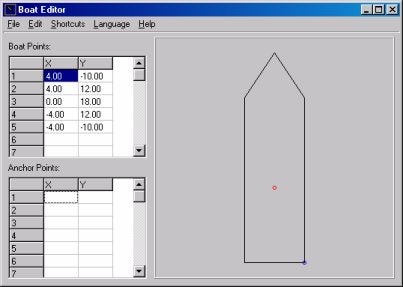
例として戦艦USSワシントンのボート形状を作成しました。まず、ボートの各折点の座標を得るために、戦艦のダイアグラムをディジタル化します。それから船の一般的なアウトラインのポイントを入力します。ボート起点( 0X、0Y )を適当な位置に設定し、その周辺でアウトラインを作成します。基点より右舷側がXの正方向、前方がYの正方向です。
次のステップは、戦艦の特徴(ブリッジ、銃、スタック等)のそれぞれの座標値をDrawing Objects欄に入力します。これらの座標値は、1つのラインとして入力されなければなりません。この戦艦上の砲台などに独立した動きなど加える場合、 対象となるオブジェクトを別の船として登録します。そうすることでSurveyプログラム上に回転する砲台などを表示することが可能になります。
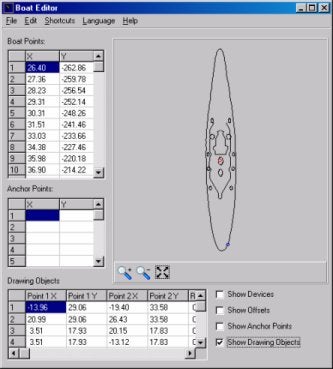
以下にHYPACK® Surveyで表示された戦艦を示します。砲台を回転させるにはHYPACK® Hardwareでsim32.dllのコントロールパネルで設定します。
sim32.dll (海岸のOceanographics Generic Simulator )は全ての移動体のヘディングデバイスとして使用することができます。
下記に揚げる例はF18と航空母艦です。
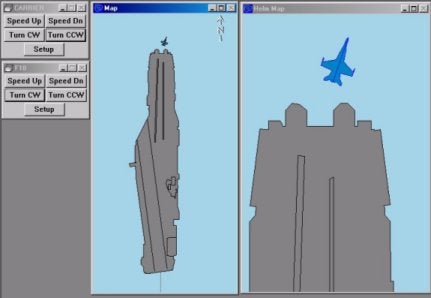
これらの例はHYPACKにおける可能性を示すデモンストレーションデータです。
次のイメージは、Boat Shape Editorで多く望まれている例です。この例は、Surveyプログラムで表示されているように、浚渫機の右舷にサイド艀がある浚渫機形状を示しています。
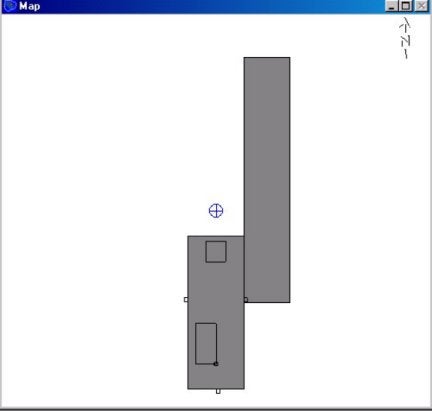
メインアウトラインは、Boat Shape EditorにおけるBoat Pointsとして、小鋤、クレーン等のような他のアイテムはDrawing Objectsとして作成しています。サークル記号は、Hardwareにおける第2の船として加えられたバケットのポジションである。
これらのボート形状は、HYPACKでは*.shpファイルしてセーブされます。(あらゆるテキストエディタにおいて修正され得る、もしくは作成され得るシンプルなASCIIテキストファイルです)。
QNew Line Editor in Hypack ® Max 02.12a
FAQ ID:Q2-10
The Line Editor has been redesigned recently and has been implemented in the new 02.12a release. Some of the new features include easy access to different lines within the *.LNW file, editing of templates and even creation of templates within the editor. The figure below shows a comparison between the old Line Editor on top and the New Line Editor at the bottom.
The buttons have been replaced with icons. Simply move the curser over each icon to display a description. The new Line Editor also displays all the line names/numbers in the left panel of the editor, making it easier to display the coordinates of a line by simply highlighting the line name or number. In the old Line Editor, you had to scroll through each line with an arrow key – pretty tedious if you have a line file containing a few hundred lines!
A brand new option is the ability to edit template information. This really comes in handy with line files created in Channel Design. Just open your *.LNW file in the Line Editor and highlight a line name/number in the left panel. Then go to the Template menu item and click on Edit. You’ll get the window shown below:
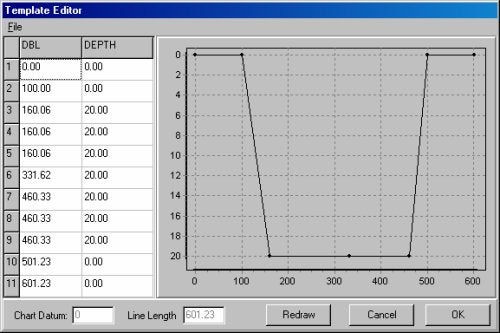
What you see on the left of the window are the template points, DBL (distance from the start of line in survey units) and depth. Change the DBL and/or depth and click on the Redraw button. The graph will then be updated with the new template points. You can modify each template separately, or apply the template changes to all the lines within that LNW file.
You can also create templates for 2D LNW files that were originally created in the Line Editor. These line files that can then be saved as 3D LNW files. This comes in really handy when you need to create a simple channel and all you have is a standard LNW file.