FAQ
HYPACKに関する質問
13.ボリューム---体積計算(Volumes)
ID.Q13-1M
Q. フィラデルフィア法体積計算結果について(Philadelphia Pre- and Post-Dredge Reports)[英語]
A.
There have recently been a lot of questions as to the meaning of items in the Philadelphia Pre-Dredge and Post-Dredge Reports of the CROSS SECTIONS program. The purpose of this article is to examine those items and to provide an explanation of differences between the Pre-Dredge and Post-Dredge numbers. I ran the Philadelphia Pre-Dredge method using a Before-Dredge (befores) and an After-Dredge (afters) data sets. I then ran the Philadelphia Post-Dredge method using both data sets.
Philadelphia Pre-Dredge Report - Befores
Let's first take a look at a section of the Philadelphia Pre-Dredge Report. If you get down to the station-by-station numbers, you'll see something like the following for your data set:
For the Station 0+10, the Left Slope has 20.0m² of material; the Left Center Channel has 13.8m² of material; the Right Center Channel has 8.6m² and the Right Slope has 15.3m².
The Offsets refer to the distance (from the centerline) to each feature. The Top of the Left Slope is -66.5m (left 66.5) from the centerline; the Left Toe Line (start of side slope) is -51.5m (left 51.5); etc.
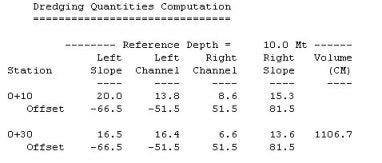
For the Section 0+30, the information is repeated. Since our lines in this test are 20m apart, we can create a simple table to determine the volumes for each section. Volume = (Area1 + Area2) * Dist / 2.
| Section/Area | Left Slope Area | Left Channel Area | Right Channel Area | Right Slope |
|---|---|---|---|---|
| 0+10 | 20.0m² | 13.8m² | 8.6m² | 15.3m² |
| 0+30 | 16.5m² | 16.4m² | 6.6m² | 13.6m² |
| Volume | 365m³ | 302m³ | 152m³ | 189m³ |
| Total Volume | 365 + 302 + 152 + 189 = 1108m³ | |||
The difference between the report's 1106.7 m³ and the 1108 m³ in our table is that the areas in the report are only reported to 0.1 precision but are maintained at a higher precision inside the program.
The same can be repeated for the numbers in the Overdepth area of the report. These numbers are located in the right-hand side of the report and contain the areas and volumes of material in the Overdepth area.
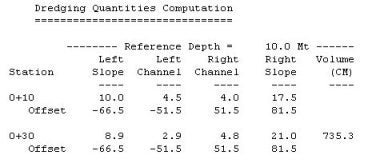
Philadelphia Pre-Dredge - Afters
I then ran the data files from the After-Dredge survey, using the same Philadelphia Pre-Dredge report. This will be handy later on when comparing numbers in the Philadelphia Post-Dredge Report.
In this case, if I repeat the computation done above, I get the volume between the two sections to be 736 m³. This is almost equal to the value in the report, the difference being that I am using the areas that have been rounded to the nearest 0.1m².
So far, so good.
Philadelphia Post-Dredge Report - Befores and Afters
Now let's take a look at the report from the Philadelphia Post-Dredge method.
There are two sets of "areas" reported for each section.
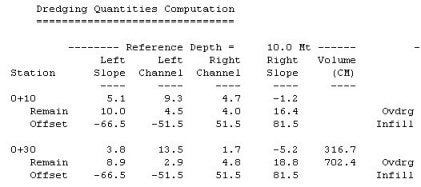
The top line (5.1 9.3 4.7 -1.2) represents the amount of material (m²) that has been removed in each segment. It determines this number by first determining where the two data sets overlap. It then computes the available area in Survey 1 (S1) and the available area in Survey 2 (S2) and computes the area of material removed (S2-S1). The negative number (Right Slope) in our example reflects that material has actually been added in the Right Slope area in the area of comparison.
The second line (10.0 4.5 4.0 16.4) represents the amount of material that is still available in the section. You will notice that these numbers are slightly different than those reported at the top of the page in the Philadelphia Pre-Dredge report using the After-Dredge data (10.0 4.5 4.0 17.5). The reason for that is that the Philadelphia Post-Dredge will only report area where there is overlapping data on both surveys. [This is also true for the material that has been removed.]
Let's take a close look at the pre-dredge and post-dredge sections for line 0+10.
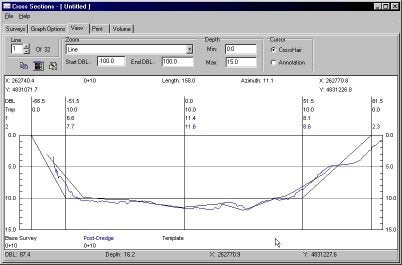
If we take a close look at the right side slope (the area from 51.5 to 81.5 on the right of the graph), the line from your before-dredge survey is displayed in black and the line from your after-dredge survey is displayed in blue. The black line stops right at the 5.0m level. For the Philadelphia Post-Dredge method, all area computations will stop at this point for both surveys. (Even though there is information in the after-dredge survey that is not going to be used.)
The post-dredge line originally reported 17.5m² of area available on the Right Slope in the Philadelphia Pre-Dredge report. In the Philadelphia Post-Dredge report, there is only 16.4 m² of area available. This is because it has not included the 1.1 m² of material that occurs beyond the point where the before-dredge survey ended.
Looking again at the Philadelphia Post-Dredge Report:
The value of 316.7 m³ reflects the amount of material that was removed between station 0+10 and 0+30. Once again, this is only computed where both data sets overlap.
The value of 702.4 m³ is the amount of material that remains to be removed (once again where we compare only areas where the two data files overlap).
In the Philadelphia Pre-Dredge report (using the after-dredge data file), it reports 735.3 m³ of available material. We have lost 32.9 m³ because the before-dredge survey did not overlap all the way across with the after-dredge survey. Note: If the after-dredge survey did not extend all of the way across and the before-dredge did extend all of the way across, the reported volumes in the Philadelphia Post-Dredge report would also be smaller than in reality.
If I take the available material generated by running the before-dredge and after-dredge surveys (separately) through the Philadelphia Pre-Dredge report and take the difference, I get 371.4 m³ (1106.7 - 735.3), versus the 316.7 m³ reported above.
Which value is correct? They are both correct. It is just that the Philadelphia Post-Dredge method is designed to only compare areas where there is over-lapping survey data.
Note: The Average End Area 3 method handles things differently. It computes all of the area under the pre-dredge survey and then computes all of the area under the post-dredge survey and then takes the difference without worrying about where the two data sets overlap. This is the major difference in the reported quantities between the two methods.
Philadelphia Post-Dredge Report - Summary
Finally, lets take a look at the Philadelphia Post-Dredge Report.
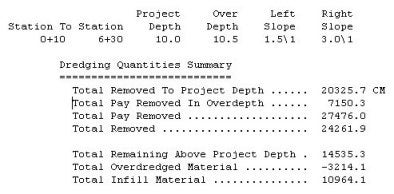
The top item is Total Removed To Project Depth. This is a sum of all of the material removed above the design template. It is computed by adding all of the reported quantities in the report. It would take the quantity between lines 0+10 to 0+30 (316.7 m³) and add it to the quantity between lines 0+30 to 0+50 (265.1 m³) and add it to the quantity between lines 0+50 to 0+70 (187.3 m³), etc.
The item Total Pay Removed In Overdepth is the sum of all of the material reported removed between the design template and the over-depth template. It's the same as above, repeated using the "over-depth" numbers in the right hand side of the report. (173.9 + 163.7 + 129.9 …..)
The Total Pay Removed is the mathematical sum of the above two item.
The Total Removed is the Total Pay Removed plus the material removed beneath the Overdepth template. In our test case, we have actually added material beneath the Overdepth template, so the Total Removed is less than the Total Pay Removed. There are no numbers in the report to confirm this. You can only examine the sections in the areas where the depths are less than the Overdepth template. It's very useful to plot out both sections on top of each other. Please look at the section below.
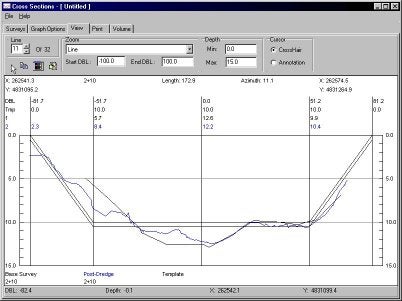
If you take a look in the area where the data is deeper than the over-depth template (center channel), the before-dredge survey (black) is deeper than the after-dredge survey. In effect, there is now more material in the center of the channel, although it is still beneath the over-depth template. This is what is causing our Total Removed to be less than our Total Pay Removed. This happens very rarely.
The Total Remaining Above Project Depth is just the sum of all of the remaining volume quantities for each pair of sections from the report below. In our case it would be 702.4 + 671.9 + 469.4 +…..
The Total Overdredged Material is the mathematical difference between the Total Removed minus the Total Pay Removed. Normally, it is used to show how much extra material the contractor removed beneath the over-depth template. Since we get a negative, it shows how much material has accumulated beneath the over-depth template in your project.
The Total Infill Material is the sum of all material where the pre-dredge survey was deeper than the post-dredge survey. There are no specific numbers provided in the report to verify this number.