FAQ
HYPACKに関する質問
13.ボリューム---体積計算(Volumes)
ID.Q13-1M
Q. フィラデルフィア法体積計算(Philadelphia Volume Tests)[英語]
A.
Tests were conducted on 1-2 March 2000 to determine the accuracy of the different volume techniques in HYPACK® Version 7.1, HYPACK® MAX (Cross Sections & Volumes) and HYPACK® MAX (TIN MODEL). Tests were run with multibeam data collected on a recent USACE Philadelphia project and with a test data set that allowed evaluation of all four box cut methods (Contour vs. Non-Contour; All vs. Shoals-Only).
A sample channel with survey data was created and is shown below.
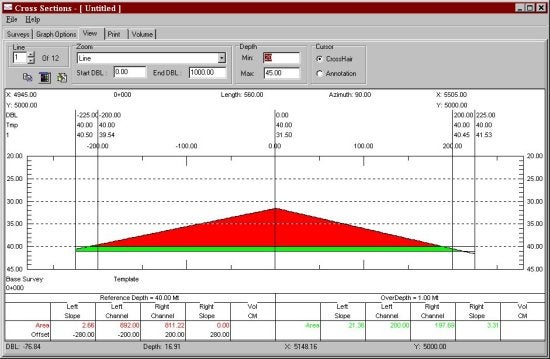
At the left toe-line the depth was above the project design depth. This meant the overdredge material on this side should be included in the Shoals-Only method. At the right toe-line, the depth was below the project depth. This meant that the overdredge material in this area would not be included in the Shoals-Only method.
On the left side, the depth passed through the design depth in the left box area. This means the contour dredge quantity for the left box area should be less than the non-contour dredge quantity. On the right side, the depth passes through the design depth in the "right of center" area. This means the contour dredge quantity for the right of center area should be less than the non-contour dredge quantity.
The points were first loaded into the HYPACK® MAX TIN MODEL program, along with the planned line file. The planned line file contained 11 lines at 100' spacing. Volume numbers presented below are in cubic feet.
TIN MODEL Tests
(Calculated quantities in black; Mathematical prediction in red.)
| Method | Dredge Left Box | Dredge Left Channel | Dredge Right Channel | Dredge Right Box | Overdredge Left Box | Overdredge Left Channel | Overdredge Right Channel | Overdredge Right Box |
|---|---|---|---|---|---|---|---|---|
| Non-Contour All |
3,125 |
900,000 (100%) 900,000 |
802,736 (99.99%) 802,736 |
0.0 (100%) 0.0 |
21,875 (100%) 21,875 |
200,000 (100%) 200,000 |
197,224 (100%) 197,222 |
2,776 (88.78%) 2,750 |
| Contour All | 3,125 (100%) 3,125 |
900,000 (100%) 900,000 |
802,736 (100%) 802,736 |
0.0 (100%) 0.0 |
12,500 (100%) 12,500 |
200,000 (100%) 200,000 |
188,800 (99.95%) 188,888 |
0.0 (100%) 0.0 |
| Contour Shoal-Only | 3,125 (100%) 3,125 |
900,000 (100%) 900,000 |
802,736 (100%) 802,736 |
0.0 (100%) 0.0 |
12,500 (100%) 12,500 |
200,000 (100%) 200,000 |
188,800 (99.95%) 188,888 |
0.0 (100%) 0.0 |
| Non-Contour Shoal-Only | 3,125 (100%) 3,125 |
900,000 (100%) 900,000 |
802,736 (100%) 802,736 |
0.0 (100%) 0.0 |
25,000 (100%) 21,875 |
1,100,000 (100%) 200,000 |
999,960 (529%) 197,222 |
0.0 (100%) 0.0 |
1. All of the Dredge quantities are mathematically correct.
2. The Contour vs. Non-Contour and All vs. Shoals-Only only effect the Overdredge Quantities
3. All of the Overdredge methods appear to be correct, with the exception of the Non-Contour - Shoals Only method. This method is reporting erroneous quantities and needs to be fixed.
HYPACK® 7.1 Tests
(Calculated quantities in black; Mathematical prediction in red.)
| Method | Dredge Left Box | Dredge Left Channel | Dredge Right Channel | Dredge Right Box | Overdredge Left Box | Overdredge Left Channel | Overdredge Right Channel | Overdredge Right Box |
|---|---|---|---|---|---|---|---|---|
| Non-Contour All |
3,109 |
900,000 (100%) 900,000 |
802,800 (100%) 802,736 |
0.0 (100%) 0.0 |
21,900 (100.11%) 21,875 |
200,000 (100%) 200,000 |
197,200 (99.99%) 197,222 |
2,800 (101.82%) 2,750 |
| Contour All | 3,109 (99.49%) 3,125 |
900,000 (100%) 900,000 |
802,800 (100%) 802,736 |
0.0 (100%) 0.0 |
12,000 (96.00%) 12,500 |
200,000 (100%) 200,000 |
189,000 (100%) 188,888 |
0.0 (100%) 0.0 |
| Contour Shoal-Only | 3,109 (99.49%) 3,125 |
900,000 (100%) 900,000 |
802,800 (100%) 802,736 |
0.0 (100%) 0.0 |
12,000 (96.00%) 12,500 |
200,000 (100%) 200,000 |
189,000 (100%) 188,888 |
0.0 (100%) 0.0 |
| Non-Contour Shoal-Only | 3,109 (99.49%) 3,125 |
900,000 (100%) 900,000 |
802,800 (100%) 802,736 |
0.0 (100%) 0.0 |
21,900 (100.11%) 21,875 |
200,000 (100%) 200,000 |
197,200 (99.99%) 197,222 |
0.0 (100%) 0.0 |
1. All of the quantity calculations were very close. The largest difference was 500 ft³ on the Left Box Overdredge for the Contour methods.
2. Wow! Pretty good.
HYPACK® MAX Tests
(Calculated quantities in black; Mathematical prediction in red.)
| Method | Dredge Left Box | Dredge Left Channel | Dredge Right Channel | Dredge Right Box | Overdredge Left Box | Overdredge Left Channel | Overdredge Right Channel | Overdredge Right Box |
|---|---|---|---|---|---|---|---|---|
| Non-Contour All |
3,145 |
900,000 (100%) 900,000 |
802,730 (100%) 802,736 |
0.0 (100%) 0.0 |
21,882 (100.03%) 21,875 |
200,000 (100%) 200,000 |
197,200 (100%) 197,222 |
2,780 (101.09%) 2,750 |
| Contour All | 3,145 (100.64%) 3,125 |
900,000 (100%) 900,000 |
802,730 (100%) 802,736 |
0.0 (100%) 0.0 |
12,545 (100.36%) 12,500 |
200,000 (100%) 200,000 |
188,800 (100%) 188,888 |
0.0 (100%) 0.0 |
| Contour Shoal-Only | 3,145 (100.64%) 3,125 |
900,000 (100%) 900,000 |
802,730 (100%) 802,736 |
0.0 (100%) 0.0 |
12,545 (100.36%) 12,500 |
200,000 (100%) 200,000 |
188,800 (100%) 188,888 |
0.0 (100%) 0.0 |
| Non-Contour Shoal-Only | 3,154 (100.64%) 3,125 |
900,000 (100%) 900,000 |
802,730 (100%) 802,736 |
0.0 (100%) 0.0 |
21,882 (100.03%) 21,875 |
200,000 (100%) 200,000 |
197,220 (99.99%) 197,222 |
0.0 (100%) 0.0 |
Wow! Even a little better than 7.1. These guys really know what they are doing!
ACTUAL DATA TEST: POOLE'S ISLAND RANGE C&D APPROACH CHANNEL
Volumes were calculated using the Contour - All method for single beam data using the HYPACK® MAX and HYPACK® 7.1 VOLUME programs. Data collected with the multibeam system was also processed and volumes computed with the TIN MODEL program. The results are shown below.
|
Method |
Material to Project Depth | Allowable Overdepth | Total Pay Place |
|---|---|---|---|
| Single Beam 7.1 | 81,742 cu.yds. (98.2% of MB) |
51,579 cu.yds. (101.0% of MB) |
133,322 cu. yds. (99.3% of MB) |
| Single Beam MAX | 81,747 cu. yds. (98.2% of MB) |
51,586 cu. yds. (101.0% of MB) |
133,333 cu. yds. (99.3% of MB) |
| Multibeam TIN MODEL | 83,219 cu. yds. | 51,084 cu. yds. | 134,303 cu. yds. |
1. The Single Beam techniques calculated slightly less "Material to Project Depth" and slightly more "Allowable Overdepth". The total material was less than 1% difference from the multibeam survey. This number is small for other tests done in the past. Typically, we have found the difference between single beam and multibeam surveys to yield normally up to 3% more material and sometimes as much as 6%. The above results are probably as close as you are going to see.
TEST: Matrix Cell Size vs. Dredge Quantities
The same edited multibeam data set was gridded at 1'x1', 5'x5' and 10'x10' cell sizes. The resulting XYZ data files were then run through the HYPACK® MAX - TIN MODEL program and volumes were calculated using the Philadelphia Box Cut method. The 1x1 data set contained 979,000 data points.
Computed volumes were:
|
Matrix Cell Size |
Normal Material (cu. yds.) |
Overdrege Material (cu. yds.) |
Total Material (cu. yds.) |
TIN & VOLUME Time to Finish |
|---|---|---|---|---|
| 1 x 1 | 83,173 | 50,969 | 134,142 | 7 hrs 15 min |
| 5 x 5 | 83,219 | 51,084 | 134,303 | 0 hrs 26 min |
| 10 x 10 | 83,305 | 50,978 | 134,283 | 0 hrs 3 min |
1. As shown by previous studies, the increased density of data points does not improve the results of the volume quantities. The longer processing time for dense data sets does not result in significantly different volumes.