FAQ
HYPACKに関する質問
5.一般事項(HYPACK® Max General)
ID.Q5-13
Q. S-57電子海図について[英語]
A.
One of the many changes in the hydrographic field over the past ten years is the use of S-57 for the storage, presentation and transfer of digital chart data. Coastal Oceanographics has been working for several years to be able to present S-57 format files in our HYPACK® MAX and other packages. As a result of this work, we have developed a product to create, maintain and update S-57 chart data.
S-57 is shorthand for Special Publication No. 57, “IHO Transfer Standard for Digital Hydrographic Data”. IHO is the acronym for the International Hydrographic Organization.
The purpose of this document is to provide you with a simple and straight-forward overview of the S-57 format. In other words, this document is sort of like an ‘S-57 for Dummies’ where the intent is to de-mystify how data is stored and managed.
A. Feature and Spatial Data
An S-57 file contains digital chart information that is divided into feature and spatial data. A feature is some kind of object, such as a buoy, or a rock, or a traffic separation zone or a light or one of several hundred available objects in S-57. There are point objects (buoys, wrecks, lights, ….), polyline objects (pipelines, cables, roads, ….) and closed polygon objects (depth areas, anchorages, shoreline, …..).
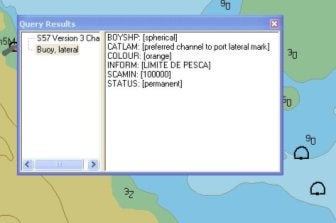
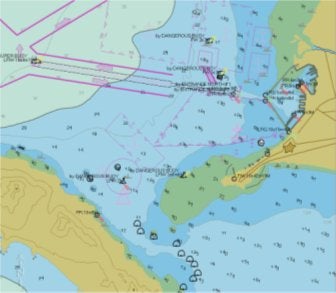
Each feature can be further described by a list of available attributes. For example, the lateral buoy shown in the lower right of the figure contains the following attribute information:
BOYSHP: [spherical]
CATLAM: [preferred channel to port lateral mark]
COLOUR: [orange]
INFORM: [LIMITE DE PESCA]
SCAMIN: [100000]
STATUS: [permanent]
Each attribute is described by a six-letter abbreviation. Thus, BOYSHP = Buoy Shape, SCAMIN = Scale Minimum. Each attribute can require a user entry, a single user choice from a list, or multiple user choices from a list.

For example: The window to the right is the Attribute Editor for the INFORM attribute. It allows you to enter a single line of text. In this case, we have entered ‘Fishing Limit’.
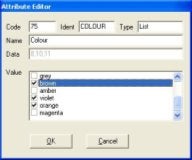
2nd Example: The window to the right is the Attribute Editor for the COLOUR attribute. Note that we can select a single color or multiple colors to describe the object. [In this example, we have the famous brown, violet and orange buoy, used to denote islands inhabited by people with no sense of color coordination.]
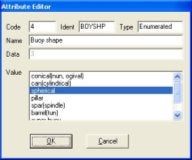
3rd Example: The window to the right is the Attribute Editor for the BOYSHP (Buoy Shape) attribute. In this case, we can only select one item from the available list.
So, a feature tells us what kind of object we have and there are attributes assigned to the feature to tell us some more details. We haven’t yet described where the object is located. That is done with the spatial data.
Spatial data is a fancy way of saying ‘where is the feature located’. In the S-57 format, the locations of objects are described by their WGS-84 positions. Although a user interface might allow you to enter and display the spatial data on a local coordinate system, deep in the bowels of the S-57 file, all the S-57 data is being written as a geographic coordinate (Latitude and Longitude) in WGS-84.
B. Nodes, Chains and Areas
It would have been simpler if they named these Points, Lines and Areas.
One of the favorite buzzwords of an S-57 jockey is ‘chain-node topography’. It’s a fancy way of saying that everything in your S-57 file is either a point (‘node’) or a series of lines (‘chains’). Sometimes the lines form an enclosed shape (‘area’).
A node is a single spatial data point, composed of a WGS-84 coordinate pair. There are two kinds of nodes, isolated and connected. An isolated node represents the position of a point feature, like a buoy or a rock or a wreck. It can’t be used for anything else.
A chain (also referred to by some as an ‘edge’) is a line or a polyline, constructed between two or more coordinate pairs. At each end of the edge is a connected node. We can connect one chain to another by either having them share the same connected node or by making another chain that connects their connecting node with a single line.
An area (also called a ‘face’ by some) is a series of chains (or a single chain) that starts and ends at the same connecting node. In other words, it’s a polygon that describes an area. An area can contain multiple chains (and contain multiple connecting nodes) or can be comprised of a single edge that starts and ends at a single connecting node.
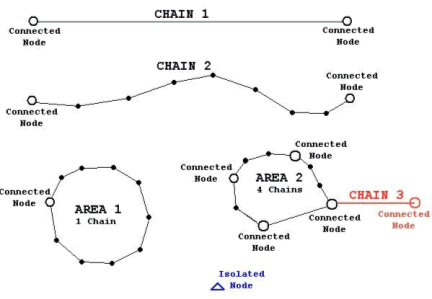
At the top of the adjacent figure is CHAIN 1. This consists of a single line drawn between two connected nodes. This is the simplest of chains.
CHAIN 2 shows a series of coordinate pairs, terminated by connected nodes. This is more typical of an chain.
AREA 1 shows an area constructed from a single chain. It starts and ends on the same connected node.
AREA 2 shows an area constructed from four chains. It is very typical for a area to consist of multiple chains. You can also see another chain (CHAIN 3) taking off from a connected node. This is also very typical, as several features may share the same connecting nodes.
One of the things to keep in mind when you define an area is that as you move along a chain that bounds the area, the enclosed area is always off the right side of the chain.
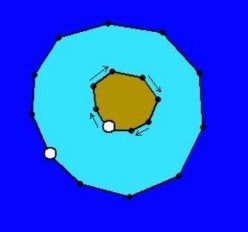
Take a look at the graphic to the right that shows an island (brown), surrounded by a Depth Area (0m to 5m in Light Blue), surrounded by a deeper depth area.
When we create the chain that describes the island as a ‘Land Area’, we need it to go counter-clockwise. That way, the area we are interested in defining is to the right as we traverse around the chain.
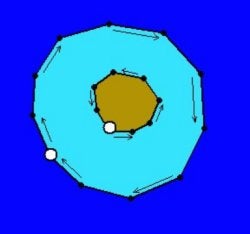
Now take a look at the graphic used to define the Depth Area. We need to define an area with a hole in it. This is done by defining one polygon along the outside and a second polygon along the inside.
Note that the chain defining the outside goes in a clockwise direction, keeping the Depth Area to the right. The chain surrounding the hole (island) travels in a counter-clockwise direction, meaning the depth area is to the right.
Luckily, we can use the same chain to define the Land Area and the inside of the Depth Area. When I select a chain to be used in the definition of an area, I can ‘reverse’ the direction of the chain when used by a particular feature.
C. Combining Features and Spatial Data
The S-57 format stores feature and spatial data as separate records. Each feature record contains information as to what spatial record(s) applies to the feature.
When I want a new buoy to be included in my S-57 file, I first create the buoy ‘feature’ and specify the attributes for the buoy. I then give it the position where I want it to place the buoy. A new feature record will be created that contains the feature type and attribute info. A new spatial record will be created that contains the coordinate point (as an isolated node).
When drawing the S-57 data, it comes across the new buoy in the feature records. It figures out what kind of buoy to draw and what labels are drawn with it from the attribute information in the feature record. The same feature record also contains the location of the spatial record that tells me where to draw the buoy. I open up the spatial record, get the coordinate pair for the buoy and then draw the feature at that location.
This seems a little crazy. Why not just keep the spatial data with each feature record?
One reason for the separation of feature and spatial data is that the same chain might be used for several different features. In our previous example with the island and the depth area, the same chain is used to create the Land Area and the Depth Area. Rather than listing the same set of points for each feature, we save space by only listing the points in one place.
Also, by using this approach, if we change a coordinate pair in the chain used to define the Land Area, we are also automatically changing the coordinate pair used in defining the Depth Area. If each feature had its own set of separate coordinate lists, we would have to make sure that we changed the coordinate pair in every feature’s coordinate list, instead of changing it in only one location in the S-57 scheme.
D. Boundaries and Clipping
S-57 files are ‘bounded’ by two parallels of latitude and two parallels of longitude. The area formed by the bounds is sometimes referred to as the ‘bounding rectangle’. It’s illegal to have any spatial data located outside the boundary area.
In the graphic shown, the top chain would be ‘illegal’, because it contains coordinate pairs that are outside the bounding rectangle.
The lower series of chains forms a legal area. We created it with ‘connected nodes’ along the boundary line, as other features may want to take off from these points.
Some S57 Editors will either automatically clip your chains that pass outside the bounding rectangle while others will just notify you that you have an illegal chain.